![econlifelogotrademarkedwebsitelogo[1]](/wp-content/uploads/2024/05/econlifelogotrademarkedwebsitelogo1.png#100878)


The Reopening Role of the Restroom
June 3, 2020
June 2020 Friday’s e-links: A Digest of Recent Research
June 5, 2020
As we all know, a global pandemic has created new transit trends. First, through air travel and then on the ground, we can see the changes.
Transit Trends
Air Travel
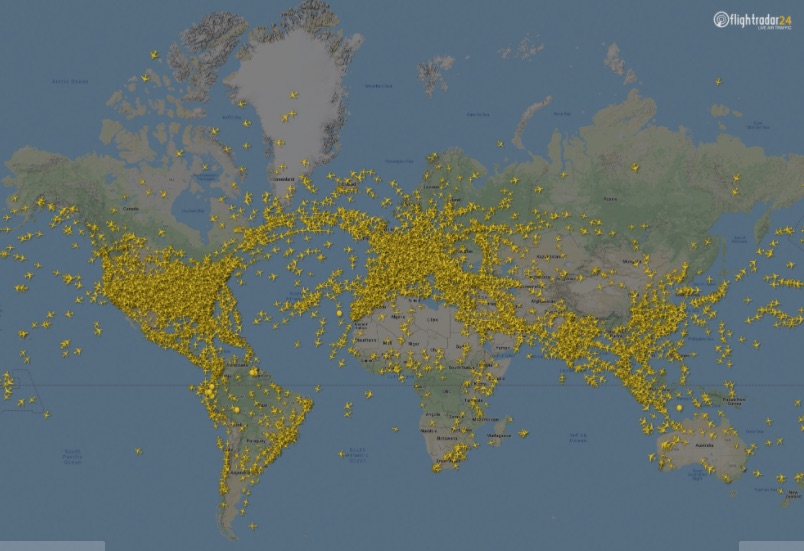
At 15:00 UTC, on March 7, an image of global air traffic displays 15,012 flights:
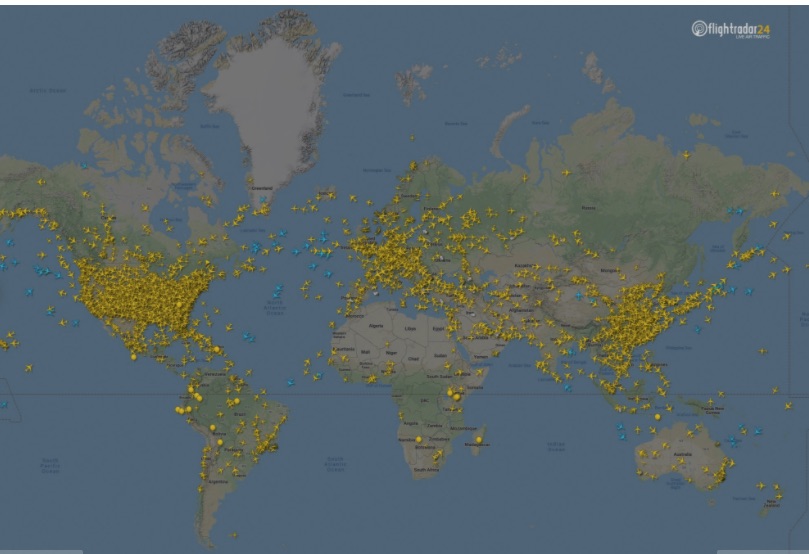
One month later, at the same time, the total was down to 5,275:
But there is much more to the story.
Traffic Congestion
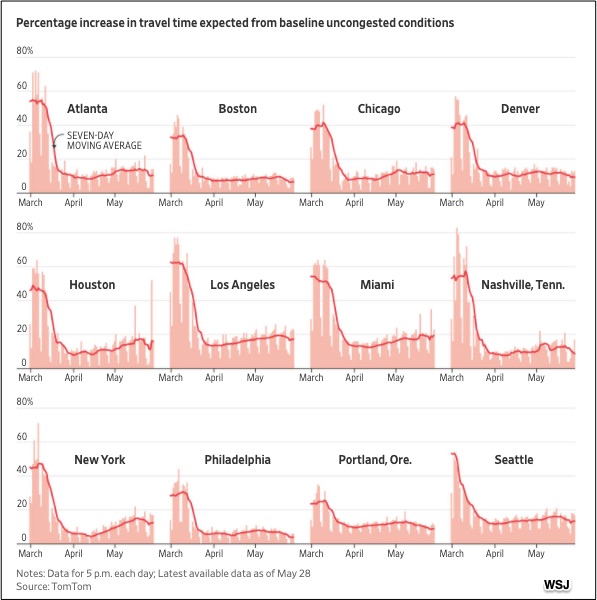
In major U.S. cities, traffic congestion is way down. Even with lockdowns lifting and gas prices plunging, we are driving much less. These graphs, from a traffic data firm, show congestion through the percent rise in travel time at 5 p.m. For example, at the March 1st height of the NYC graph, the city has 40 percent more congestion than when there is none.
Below you can see the increase in congestion for 12 U.S. cities since the beginning of March, by percent, from a “non-congestion” baseline:
Driving, Walking, and Public Transit
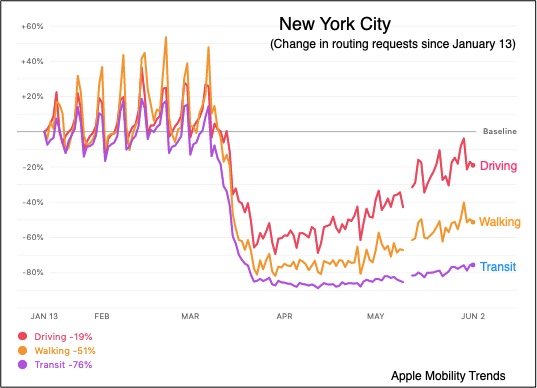
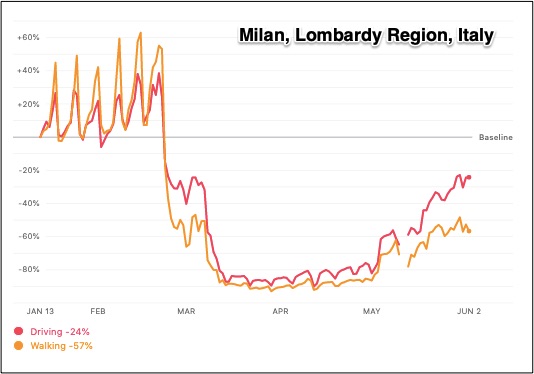
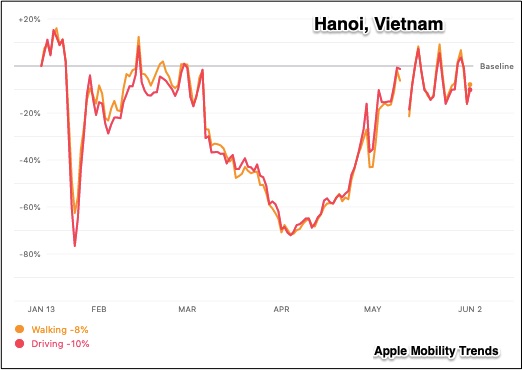
While the following Apple Mobility Trend graphs refer specifically to routing requests, they also show how our driving, walking, and transit behaviors changed during the pandemic.
In New York, bus ridership shrunk by 75 percent and the subways and ferries, a whopping 90 percent:
London, England
Milan, Italy
Hanoi, Vietnam
Seoul, Republic of Korea:
Auckland, New Zealand:
Our Bottom Line: Underutilization
As economists, we can say that the coronavirus lockdown created massive underutilization of our transportation infrastructure. Then, through a production possibilities graph we can illustrate the change in our transit trends through the land, labor, and capital that we have not been using.
The curve in our PP graph represents the maximum we could be utilizing while the dot shows the impact of the lockdown. Located far to the left on our x-axis, the dot shows underutilization of our transportation infrastructure:
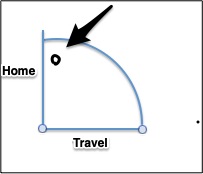
And it returns us to the air travel, cars, and municipal transit that we have minimally used.
My sources and more: Thanks to WSJ for alerting me to TomTom’s traffic data. From there, I was delighted to discover the Apple Mobility Trends reports. Then, Curbed had a closer look at the composition of NYC transit.

