![econlifelogotrademarkedwebsitelogo[1]](/wp-content/uploads/2024/05/econlifelogotrademarkedwebsitelogo1.png#100878)


What Movie Leading Roles (Don’t) Say About Diversity
June 17, 2020
How the U.S. Mint and a Breath Mint Are Causing Coin Shortages
June 19, 2020
China and Nepal used to disagree about the height of Mount Everest. Nepal counted the snow caps while China just included the rock height. Consequently, Nepal said the peak was 4 meters higher than China.
Somewhat similarly, the BLS tells us that a seasonally adjusted CPI-U was down .1 percent in May. A different lens, though, reveals that a Covid basket of goods and services would change that number.
A Covid Basket of Goods and Services
In a new NBER paper, Harvard economist Alberto Cavallo expressed concern with recent CPI statistics. He suggests that statisticians need to re-weight certain items because consumers are spending more on stay-at-home goods like food and less on their away services like transportation. In other words, traditional formulas don’t work during a pandemic.
In what he calls his “Covid Basket,” he shows a daily measure of our consumption patterns. His prices are from the Opportunity Insights Tracker (OI):
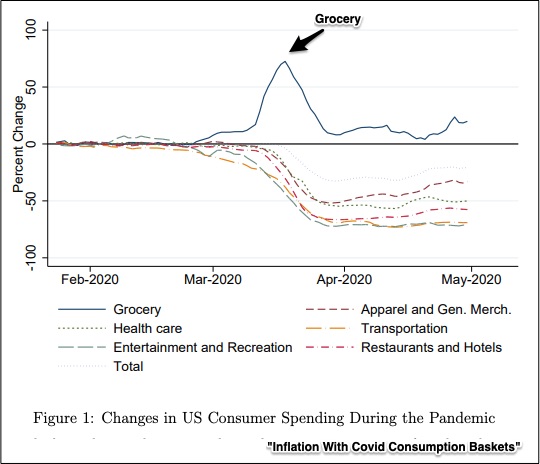
You can see the surge in grocery spending, a surge that he believes should change the calculation of the CPI. Oversimplifying a bit, we can just say that when the share of total expenditures for an item changes, so too should the CPI. But it didn’t.
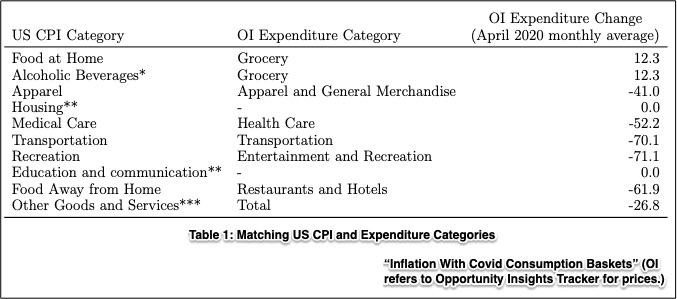
As a result, Dr. Cavallo does some comparisons. He shows what the CPI is and what it should be. New weights (red dashes) would diminish the slide in the CPI:

Two items that propel the change are food and transportation. Our increase in demand for food at home could mean its weight should increase. For the same reason, using less transportation moves energy-related numbers in the opposite direction:
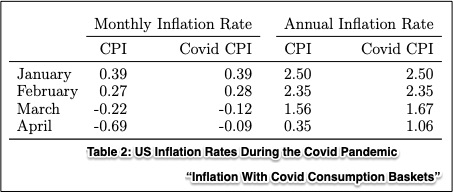
The CPI basket and Covid basket numbers start to diverge in March. The CPI declines by .22 percent while the Covid CPI reflects a .12 percent slide:
Dr. Cavallo expresses concern that the cost of living is higher than the CPI indicates. He wants policy makers to know so that they can better support low income and unemployed households.
Our Bottom Line: The CPI
In a 2010 Planet Money podcast, we meet George Minichiello, a “data collector” who is employed by the Bureau of Labor Statistics. His job is to compare changes in prices for the same items through store visits and calls. For example, surveying a $2.99 bag of romaine lettuce hearts, he said the price was the same as last month but then realized it weighed more–the equivalent of a 27% price decrease. Soon after, at a clothing store, he records the price of a boy’s shirt.
George is one of many BLS data collectors that identify prices for the CPI. Involving something like 80,000 goods and services in 8 big categories including apparel and transportation and medical care, an urban consumer’s market basket is created by the BLS.
The results are important because the CPI can be a cost of living barometer. Especially now, with soaring unemployment, our policy makers need an accurate look at our spending power. They need to know that, like Mount Everest, the numbers can vary.
My sources and more: Thanks to Marginal Revolution for once again alerting me to a new NBER paper. Then for the perfect complements, do listen to this Planet Money podcast and take a look at the most recent CPI news release.

