Our Weekly Economic News Roundup: From Moonwalks to Weather
July 27, 2019
How To Become Happier
July 29, 2019According to “The Time You Have (In Jelly Beans),” with one jelly bean for each day, 28,835 jelly beans represent all the days in an average life. Then in that life, 8,477 jelly beans show how much we sleep, 3,202 reflect how long we work, and 1,635 indicate the total days we devote to eating and preparing our food.
I do recommend using 2 minutes and 44 seconds (from the 42 million minutes in a typical life) for this jelly bean video:
So yes, we sleep for the equivalent of 8,477 days and work during 3,202 days. Now though, let’s take a closer look at how our our time use differs from the averages.
The Cost of Spending Our Time
In his new book, Spending Time, economist Daniel Hamermesh compares the ways that different groups of people allocate their time. The title is intentional. Just like money, the time we spend has a cost. Using it for one activity means sacrificing it for an alternative. The cost is the sacrifice.
Dr. Hamermesh starts out by telling us that a typical 79-year lifetime has 42 million minutes. From there, he creates a slew of distinctions. Depending, for example, on our affluence, where we live, and our age, we use those 42 million minutes differently. (Dr. Hamermesh did look at gender but so too did we at econlife, here.)
Income
Faced with time choices, those with more affluence have more alternatives. Here, Dr. Hamermesh selected the top 5% who earn close to $300,000 annually.
Earning more creates the incentive to work more. You would see a professor working six hours more each week than the U.S. average. At 10 hours more, doctors work even longer than is typical and for lawyers, the extra weekly time is three hours.
But, by working longer, there is less time for other activities. It means fewer hours are available for “home production” since preparing a meal and cleaning up afterwards are time intensive while eating take-out or going to a restaurant are not. However, they do require more money. The top 5% also sleep fewer hours, watch TV less than the rest of us, and spend more time on other leisure activities.
From there, Dr. Hamermesh observed a demographic that does not work. In the U.S., non-workers who are quite well-to-do spend fewer hours in front of the TV than those with less. The more affluent who don’t work also sleep less.
Country
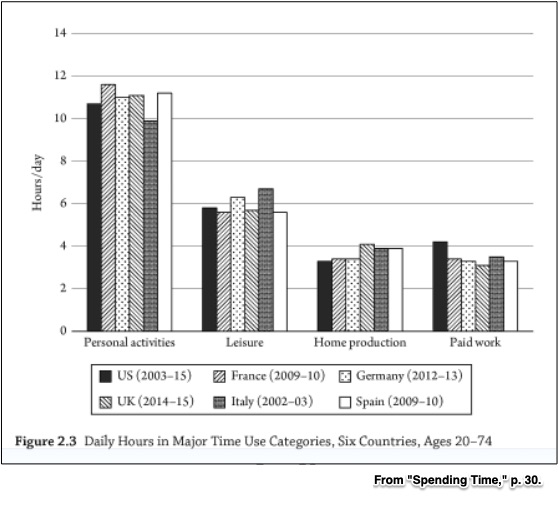
People in the U.S. work more than individuals in most other developed countries. German workers on average are on the job eight hours less per week than we are while for the French, it’s six hours less. Perhaps correspondingly, the U.S. labor force takes less vacation time.
Age and Geography
When Dr. Hamerhesh looks at age, he points out that as people age from 60 to beyond age 85, they do less paid work. Then, with the time available, they watch more TV and sleep more. Interestingly, “home production” diminishes with age.
He also compares those of us who live in rural areas to those in the city and suburbs. Here, the people in our biggest cities work longer hours and do less TV watching. The one statistic that stands out for the rural demographic is more home production than the other two groups and less time for other leisure and personal activities.
Our Bottom Line: Opportunity Cost
Putting it all together, we wind up in familiar economic territory. It takes us back to opportunity cost and the elusive free lunch. Time use decisions always require a sacrifice. Called opportunity cost, choosing is refusing the next best alternative. When someone takes you out to lunch, you might have used that same time reading your email. Watching Netflix could mean you did not talk on the phone.
And when you earn more, spending time in the kitchen can become too expensive.
My sources and more: As did I you might enjoy reading (actually skimming and focusing on certain chapters that grabbed me) the Hamermesh book. But, for the short version, this interview conveys what he says. If you are choosing though, this Econtalk podcast has the lowest opportunity cost.
![econlifelogotrademarkedwebsitelogo[1]](/wp-content/uploads/2024/05/econlifelogotrademarkedwebsitelogo1.png#100878)


