B(T)FF… Best Trading Friends Forever
February 27, 2014
Ghostbuster Economics
March 1, 2014In the 663 page report from the Financial Crisis Inquiry Commission (remember them???), the 2000-2011 real estate boom and bust is blamed on relatively predictable conditions. Just glancing at their chapter titles and conclusions, you can see that they blame risky subprime mortgages, inadequate regulation, inaccurate credit ratings and unhealthy securitization.
The FCIC report reminded me of what mathematician Benoît Mandelbrot said about a cauliflower. Each time you look more closely, you see more of its surface.
So too with FCIC. Targeting the typical catchall categories of causes, the Commission might have missed what a closer look could have revealed.
And that takes us to elasticity, a word I could not find even once in the FCIC report.
Think of a rubber band that can stretch rather easily. Applied to the supply side of markets, when production is elastic, building activity can expand or contract speedily. For housing, that means construction permits, terrain, building equipment; all are readily available. Builders are able to sign contracts and proceed quickly. Or they can cease activity rather easily too.
On the other hand, construction activity is inelastic when it cannot respond easily to price incentives. People might be interested in building but the response time is more constrained.
Looking at the housing boom and bust, scholars have been hypothesizing that elasticity was involved. They have suggested that in those areas where elasticity was greatest, supply quickly responded to price incentives. As a result, there was less pent up demand and prices built relatively moderately.
By contrast, where they identified supply inelasticity, prices built up more. In the short run, there was too much unmet demand that created price pressure cookers. In the long run, though, land, labor and capital responded. When supply increased, prices plummeted.
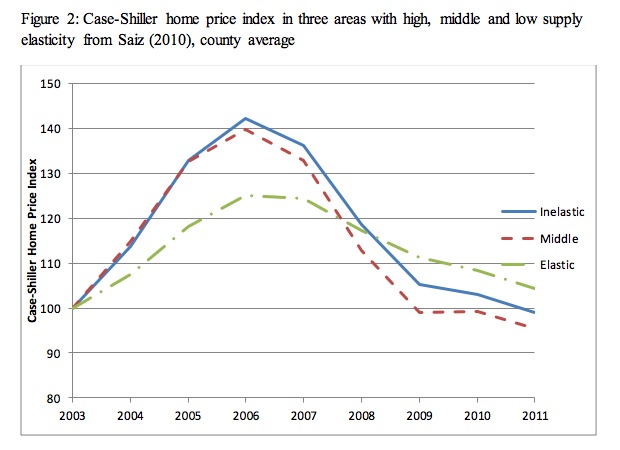
One scholar correlated home price fluctuations to supply elasticity. You can see that he is trying to show us that price spikes correspond to more inelastic supply.

From: “Housing Boom and Bust With Elastic Supplies” by Zhenyu Gao.
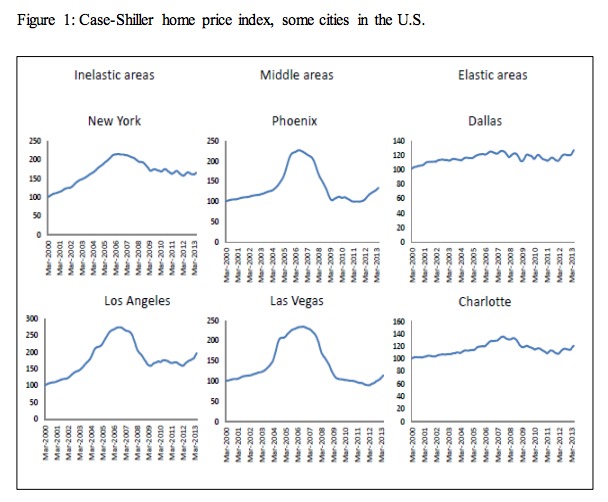
In Dallas and Charlotte, where supply was elastic, there was no boom and bust.

From: Gao, as above.
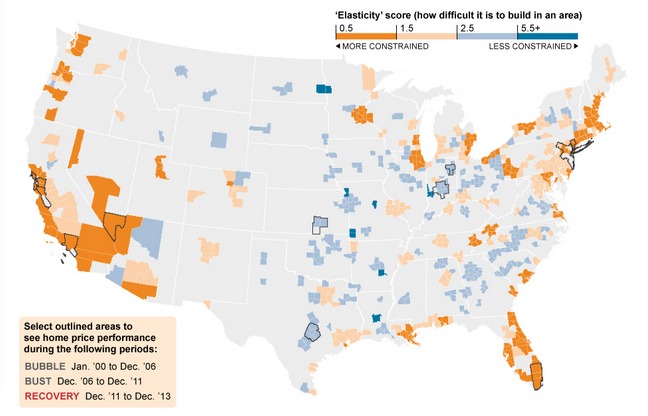
Below are the elasticity scores that a researcher assigned to 269 US metropolitan areas:

From: The Wall Street Journal
Dr. Mandelbrot said that when you look closely at “roughness,” the surface gets longer and longer. Similarly, for the housing bubble, just like with a cauliflower, the closer we look, the more infinite its many surfaces become.
Sources and resources: A clear overview from The Wall Street Journal started me down the path of increasingly academic studies like this one here, of housing bubbles and elasticity. However, again considering elasticity, an audio summary and paper on the history of housing bubbles from Ed Glaeser was rather interesting, brief and clear. Also, I do recommend looking for a moment at the voluminous “Financial Inquiry Crisis Report.”
![econlifelogotrademarkedwebsitelogo[1]](/wp-content/uploads/2024/05/econlifelogotrademarkedwebsitelogo1.png#100878)


