![econlifelogotrademarkedwebsitelogo[1]](/wp-content/uploads/2024/05/econlifelogotrademarkedwebsitelogo1.png#100878)


The One Letter That Shows the Shape of the Economic Recovery
August 17, 2020
The Pandemic’s Pepperoni Problem
August 19, 2020
It’s hard to believe that just six months ago, on February 14, 2020, phase one of the U.S. China Trade deal kicked in. Mostly it involved buying U.S. goods and services and protecting U.S. intellectual property.
According to the agreement, China had a $200 billion (or so) shopping list that included soybeans, oil and gas, airplanes, and financial services. By lowering protectionist health standards, it would be able to import more U.S. farm goods.
Below you can see the targeted items and amounts. The numbers have been called “extraordinarily ambitious” because of past trade totals:
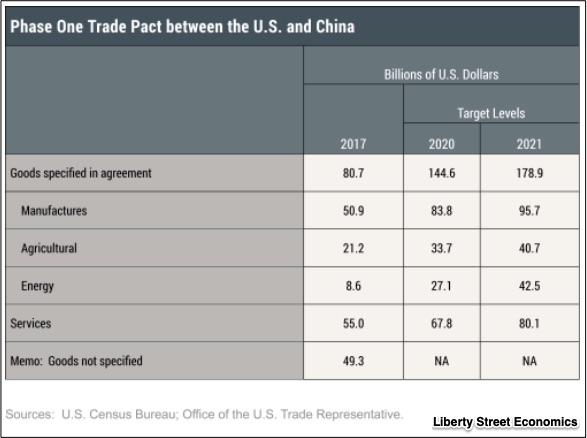
At the time, the U.S. economy was close to full capacity. With little extra to sell, U.S. producers would have had to switch destinations rather than boost production. Consequently, the impact of the deal would be minimal.
Then the pandemic hit.
Let’s take a look.
China Trade Deal Update
We know that the U.S. economy is not close to capacity. Meanwhile, China could have begun to recover from the economic impact of the pandemic. If they meet their commitments (and price is sufficiently high), they could have a positive impact on the U.S. economy through the money that farmers would receive and spend.
But, as of now, they are behind in meeting their phase one purchase commitments.
The following dashed lines illustrate their commitment for 2020 that the Peterson Institute presents on a prorated basis. Meanwhile the solid lines show what China purchased through June 2020. Essentially, we are looking at a minimum amount of $172.7 billion for 2020:
![]() The phase one pact says “The two sides acknowledge that purchases will be made at market prices based on commercial considerations.” It will be tough to respect the market if China’s buying activity accelerates.
The phase one pact says “The two sides acknowledge that purchases will be made at market prices based on commercial considerations.” It will be tough to respect the market if China’s buying activity accelerates.
Our Bottom Line: Non-Tariff Barriers
In trade wars, the basic weapons are the tariffs that make imports more expensive. Also though, countries employ less obvious tactics. They increase the paperwork that an importer needs to complete. Inspection standards can be elevated, and business licenses tougher to get. They even can make it more difficult for foreigners to obtain visas.
So, when we see that the phase one agreement relaxes some inspection standards, we can assume, they too were used in the trade war.
My sources and more: Periodically, I take a peek at the NY Fed’s Liberty Street Economics blog. After grabbing my attention, their China update, took me to the NY Times and the Peterson Institute. There also were some good articles, non-tariff trade barriers. Please note that the data in the PIIE graphs were released at the end of July and beginning of August. In addition, their U.S. export stats and China’s import numbers are shown on the graph as the two different metrics on which trade can be based.
Our featured image was from CNBC.


