![econlifelogotrademarkedwebsitelogo[1]](/wp-content/uploads/2024/05/econlifelogotrademarkedwebsitelogo1.png#100878)


Why a Queue Adds to Our Cost
September 2, 2026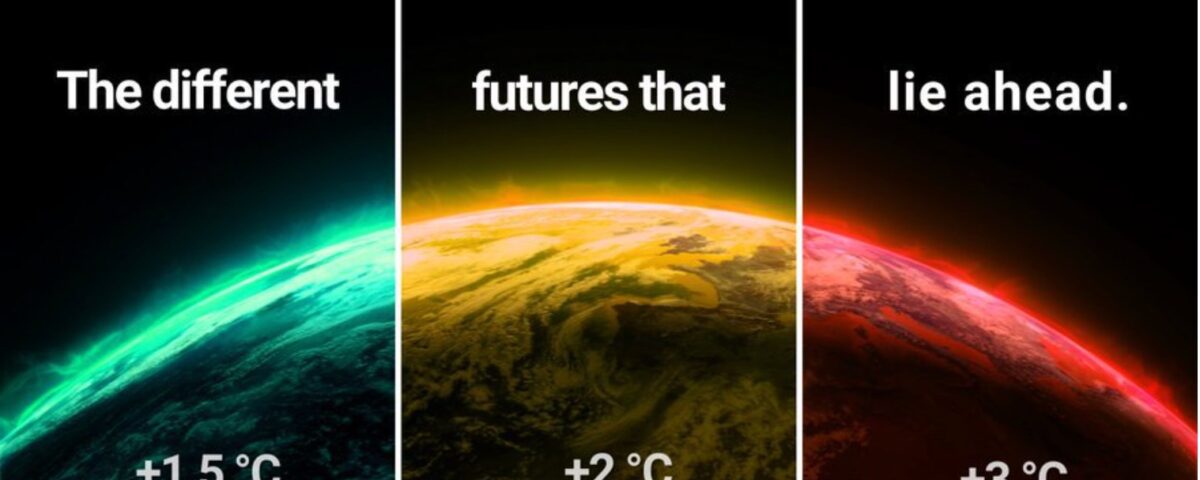
According to a new U.N. report, our global warming trajectory will soon exceed the Paris Agreement’s 1.5°C goal.
As the U.N. explains, the 1.5°C goal represents a “long-term global average surface temperature increase to be kept well below 2°C above pre-industrial levels.” Because of short-term fluctuations, their metric is a long-term average.
Shown by the following graph, that long-term average is hovering perilously close to Paris Agreement limits: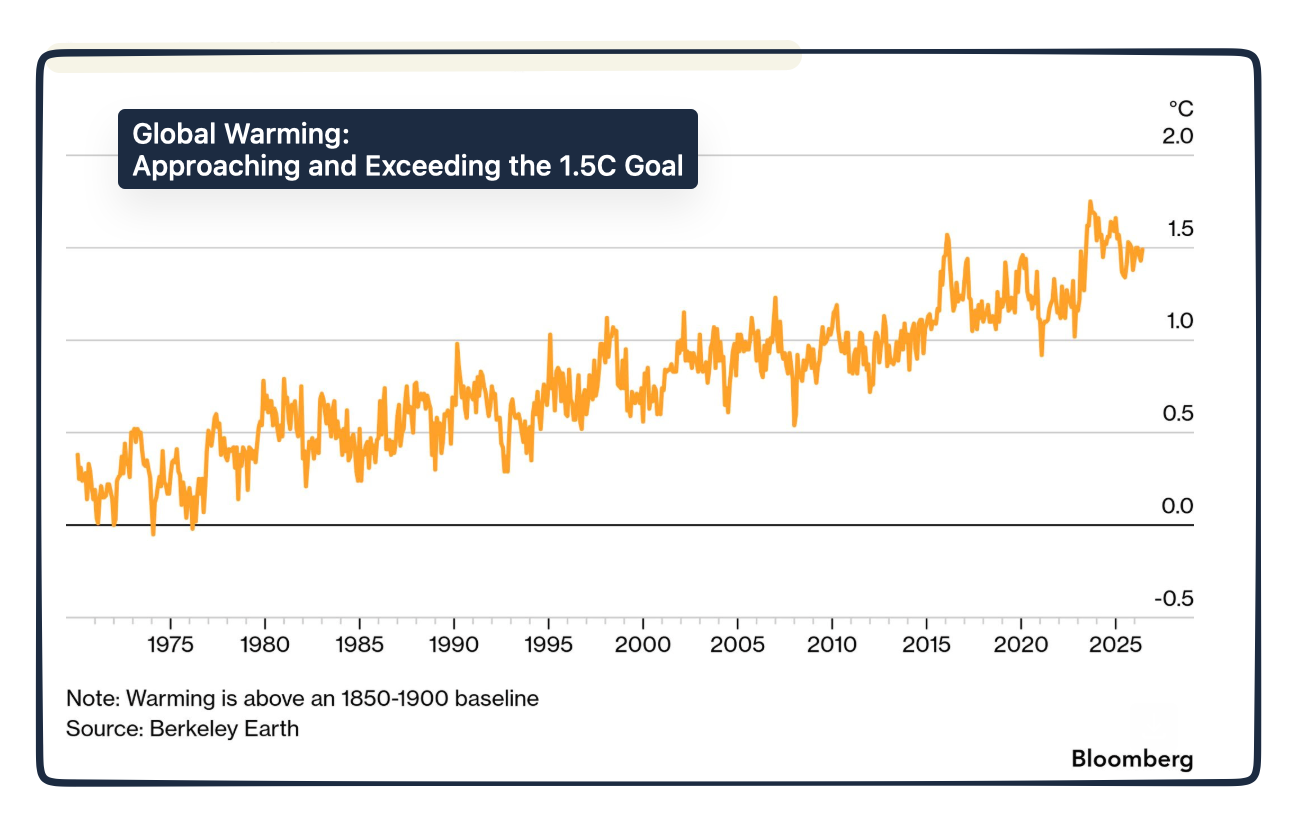
The new UN report suggests the 1.5°C goal could be unattainable and we already have some irreversible impacts. However, we can still tug temperatures down with “overshoot, peak, and decline.’ They warn us that without mitigation, we will experience “extreme weather, ecosystem loss, and submersion of Small Island Developing States and low-lying coastal cities.”
The following video clearly explains where we are, where we need to be, and how to get there:
Measuring Global Warming
So yes, we do not want average global temperatures to increase more than 1.5°C above pre-industrial levels.
But there is much more.
We have to agree on what “pre-industrial” levels mean. The Intergovernmental Panel on Climate Change (ipcc) uses estimates from 1850-1900. Because they are estimates, scholars use different temperatures as a baseline:
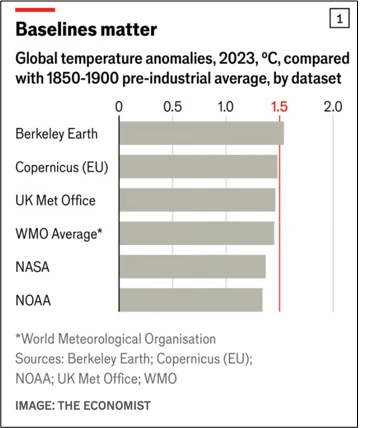
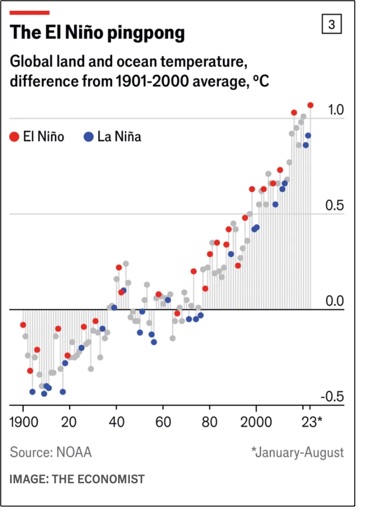
Next, we know we are referring to average global temperatures. There too, there could be several answers. After all, we can use a day, a month, a year, or a decade to calculate average temperatures. While daily averages would not make sense, yearly data also can be misleading. Below, The Economist tells us that including an unusually warm January would have nudged the 2023 average from 1.48°C to above 1.5°C:
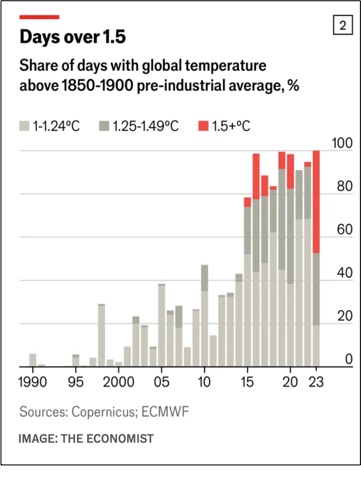
Furthermore, El Niño and La Niña create global warming statistical dilemmas because El Niño warms and La Niña cools. So, what to do during those years? As a result, the IPCC says to use a 20-year average. That means, though, that we will know we’ve exceeded the 1.5°C maximum 20 years after it happened:
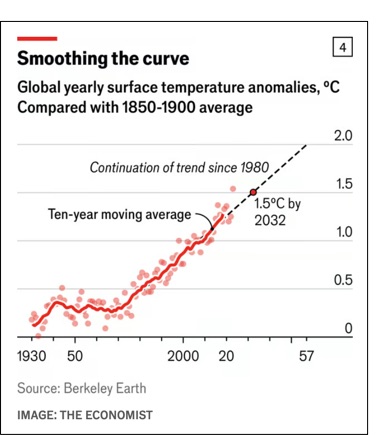
Finally, retaining our 20-year metric, we might be able to use current data as a midpoint of 10 years and then project for the next decade what the temperature increase will be. Using 2024 data, we were 1.26°C warmer than pre-industrial levels. But we still have to agree on the 10-year projection. Others suggest we ignore the 20-year benchmark and instead just calculate a trendline:
Our Bottom Line: Thinking at the Margin
An economist might say that global warming is all about the margin. Defined as where we add something extra, the margin can refer to a margin of victory (extra points), marginal revenue (extra sales dollars) or a margin of safety (longer airport runway).The UN warns us that every fractional notch above the 1.5°C benchmark will have an impact. As economists, we can say they are thinking at the margin.
My sources and more: Thanks to my Bloomberg Green (gated online but free as email) email for inspiring today’s post and providing some facts. From there, I needed this excellent UN explanation to understand the 1.5°C goal. Also, it was helpful to read the newest U.N. report on our lack of progress. And finally, we’ve quoted this past econlife post and used its sources from The Economist and The New York Times for more insight.
Our featured image is from the U.N.