![econlifelogotrademarkedwebsitelogo[1]](/wp-content/uploads/2024/05/econlifelogotrademarkedwebsitelogo1.png#100878)


Our Weekly Economic News Roundup: From Car Colors to Betting Markets
April 3, 2021
Why Trappist Beer Needs More Monks
April 5, 2021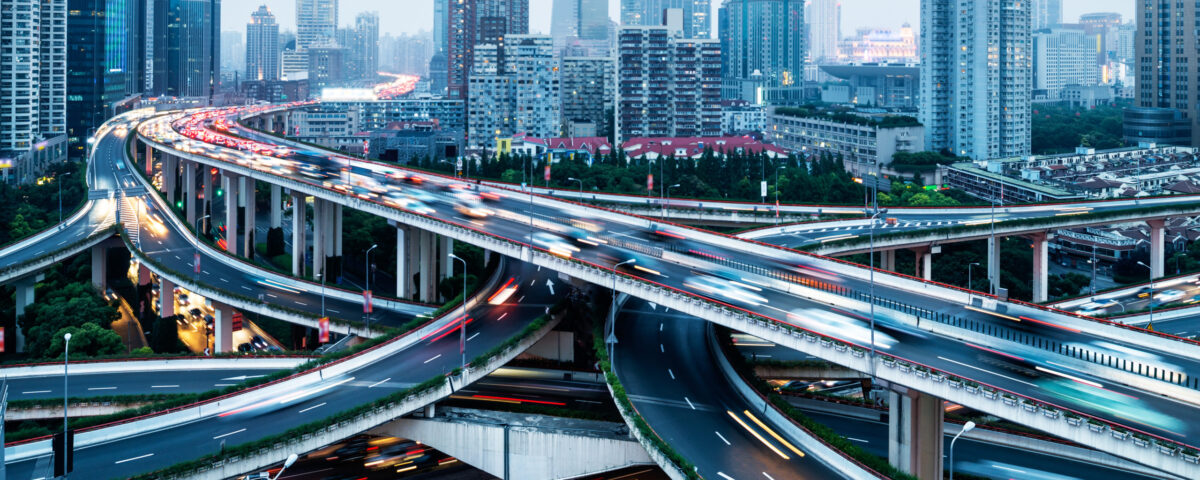
The transportation component of the Biden infrastructure bill included repairing 10,000 bridges and modernizing 20,000 miles of roads. It also has plans for air, rail, water, and public transport:

The report from the American Society of Civil Engineers (ASCE) confirms the need for considerable refurbishing and rebuilding. So too does a U.S. road quality rank from the World Economic Forum.
U.S. Transportation Infrastructure
Report Card
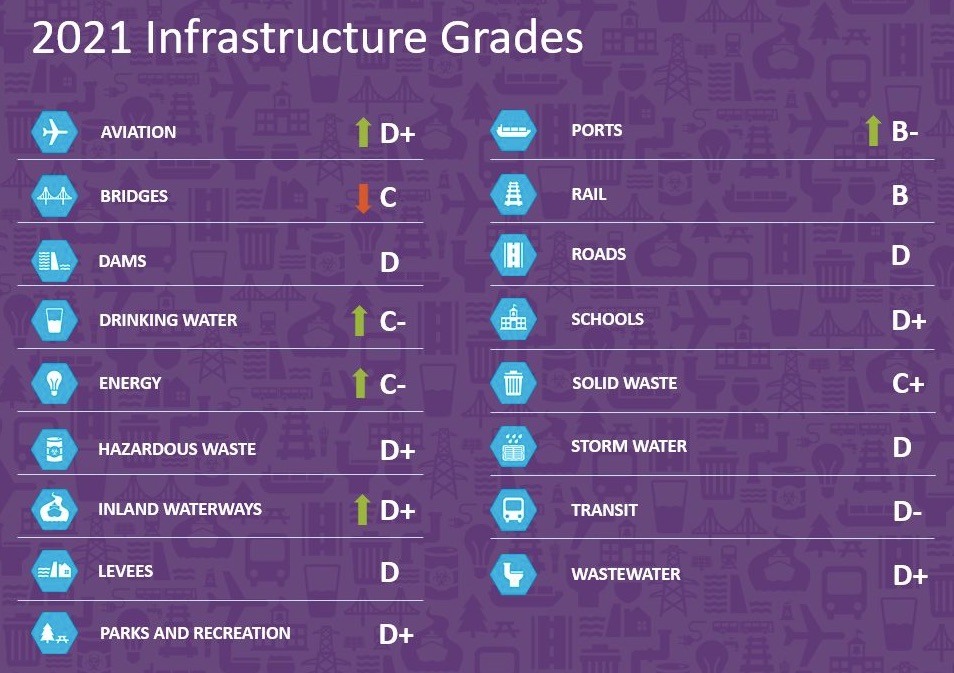
Every four years, the American Society of Civil Engineers (ASCE) publishes an infrastructure report card for the U.S. Our 2017 average grade was D+ for 16 categories. This year, with a C- average, we fared a bit better because aviation and ports went up by a half grade:
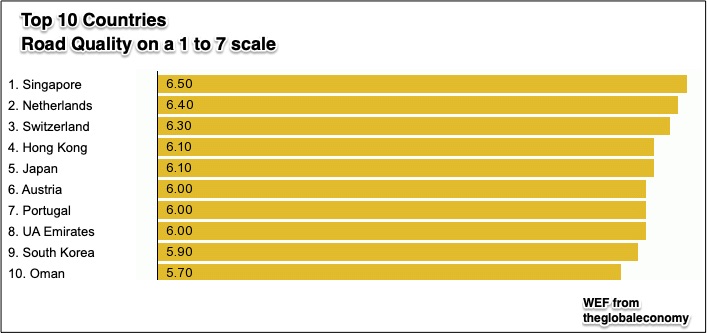
Road Quality
In a 2019 report from the World Economic Forum, Singapore and the Netherlands topped a road quality list of 141 countries while the U.S., with a 5.50 score, was #17:
Our Bottom Line: The Decisions
Funding
To pay for infrastructure projects, Congress will have to decide where to increase taxes and how much more to borrow. In 2015, when they were slow to agree on the funding for FAST (Fixing America’s Surface Transportation Act), part of the solution was Federal Reserve dividend money, strategic oil reserve sales and whatever they could raise from tax scofflaws.
Short or Long Term
We also will have to choose between a short term job boost and long term economic growth. As economist Tyler Cowen points out at Bloomberg, all infrastructure is not equally beneficial. Sometimes a short term project will enable a politician to say he created hundreds of jobs. But poorly executed, the benefit is fleeting. Instead he would need to take credit for an investment that would become fully productive in two decades:

Repair or Replace
We also have to decide whether the focus should be repair or replace. Again here, the politician’s incentive could be counterproductive. The razzle-dazzle of a new high speed train or bridge could outshine the need for basic maintenance.
Allocation
And still it gets more complicated. As you can see from this Pew infographic, the Congress has to agree on the state and local recipients:

We could say that the concrete decisions will be the most difficult.
My sources and more: After looking at the ASCE report card, you might continue with two NBER papers, here and here. In addition, do take a look at this graph to compare road quality for 141 countries and at Pew. But finally, this article from fivethirtyeight, this research from the Congress, and this analysis from Bloomberg convey the reality of our infrastructure challenge. Please note that parts of “Our Bottom Line” were previously published in a past econlife post.
