![econlifelogotrademarkedwebsitelogo[1]](/wp-content/uploads/2024/05/econlifelogotrademarkedwebsitelogo1.png#100878)


How Rising Food Prices Change Demand
September 23, 2025
How Giant Vegetables Take Us to the Margin
September 25, 2025
Comparing wages, we usually express a dollar amount. However, there is a better alternative.
We can use hamburgers.
Comparing Wages
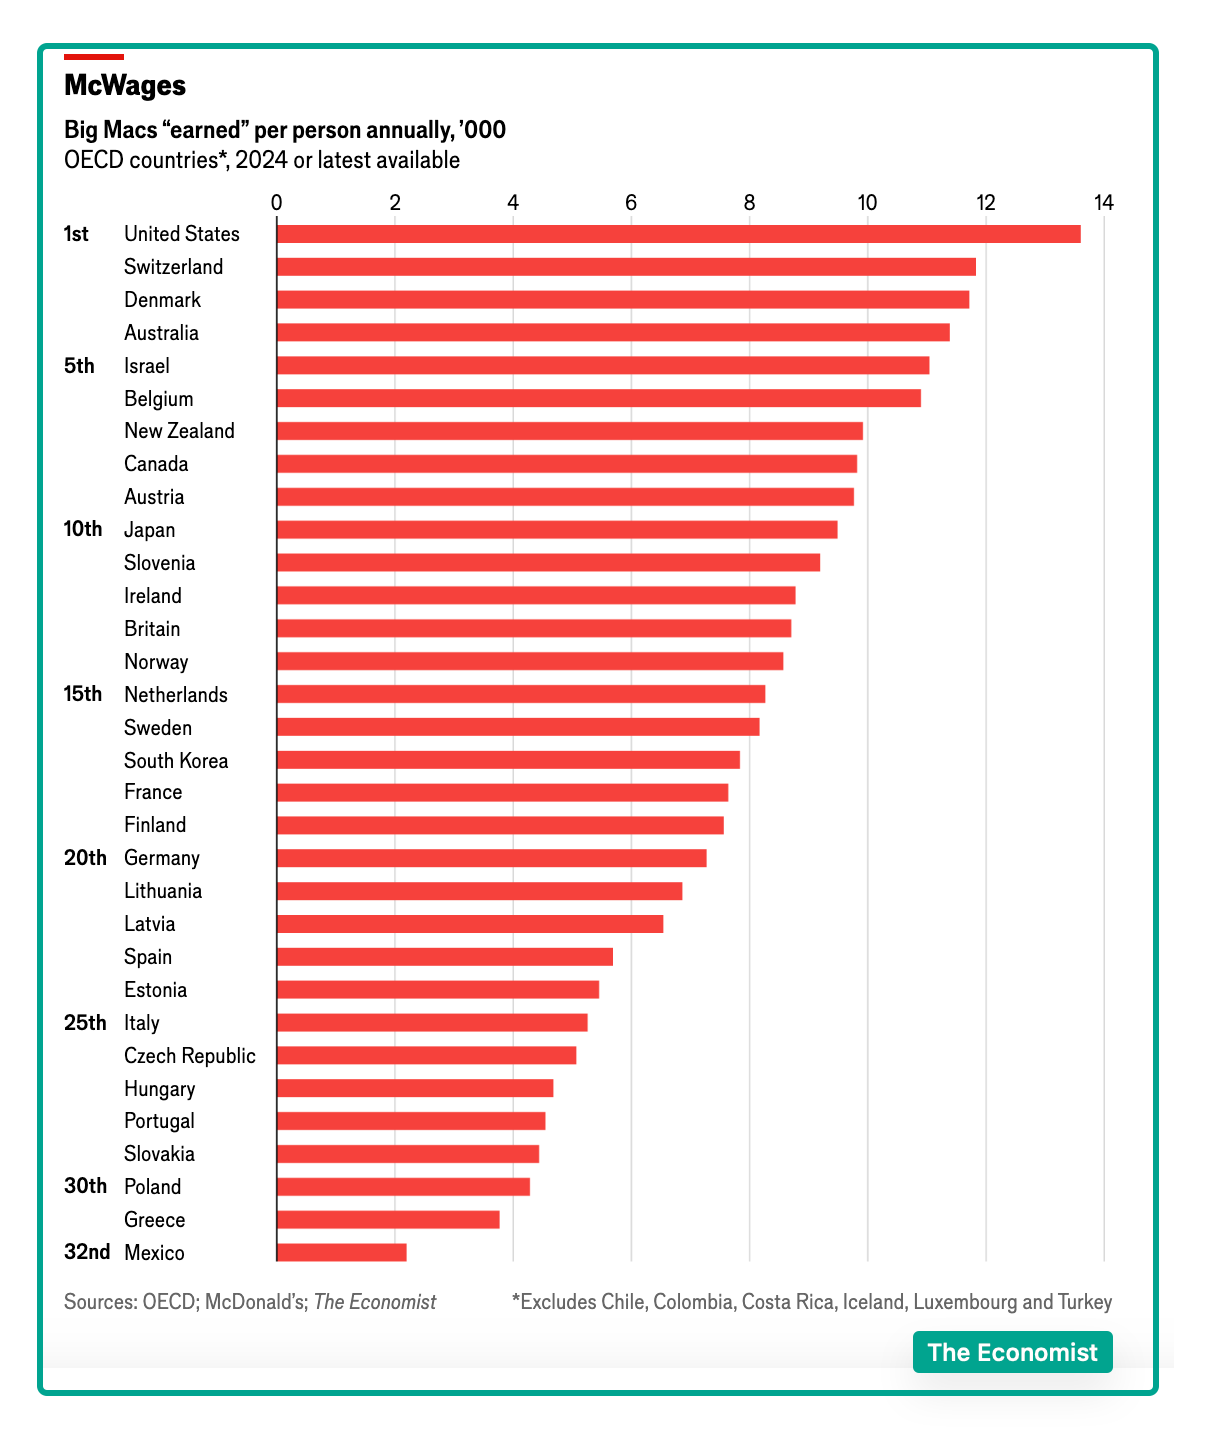
As a common denominator, the Big Mac comes in handy. Similar in restaurants around the world, it is easy to compare. From there, we just need two sets of statistics. Identifying an average country wage, we can go to the OECD–(the Organization for Economic Co-operation and Development). After that, knowing the price of a Big Mac in each country, the statisticians (making a few more tweaks) just need to divide.
At 13,601, America’s Big Mac annual intake topped the list. Far behind in second place, the Swiss worker’s total was 11,826. These were The Economist’s results for yearly consumption:
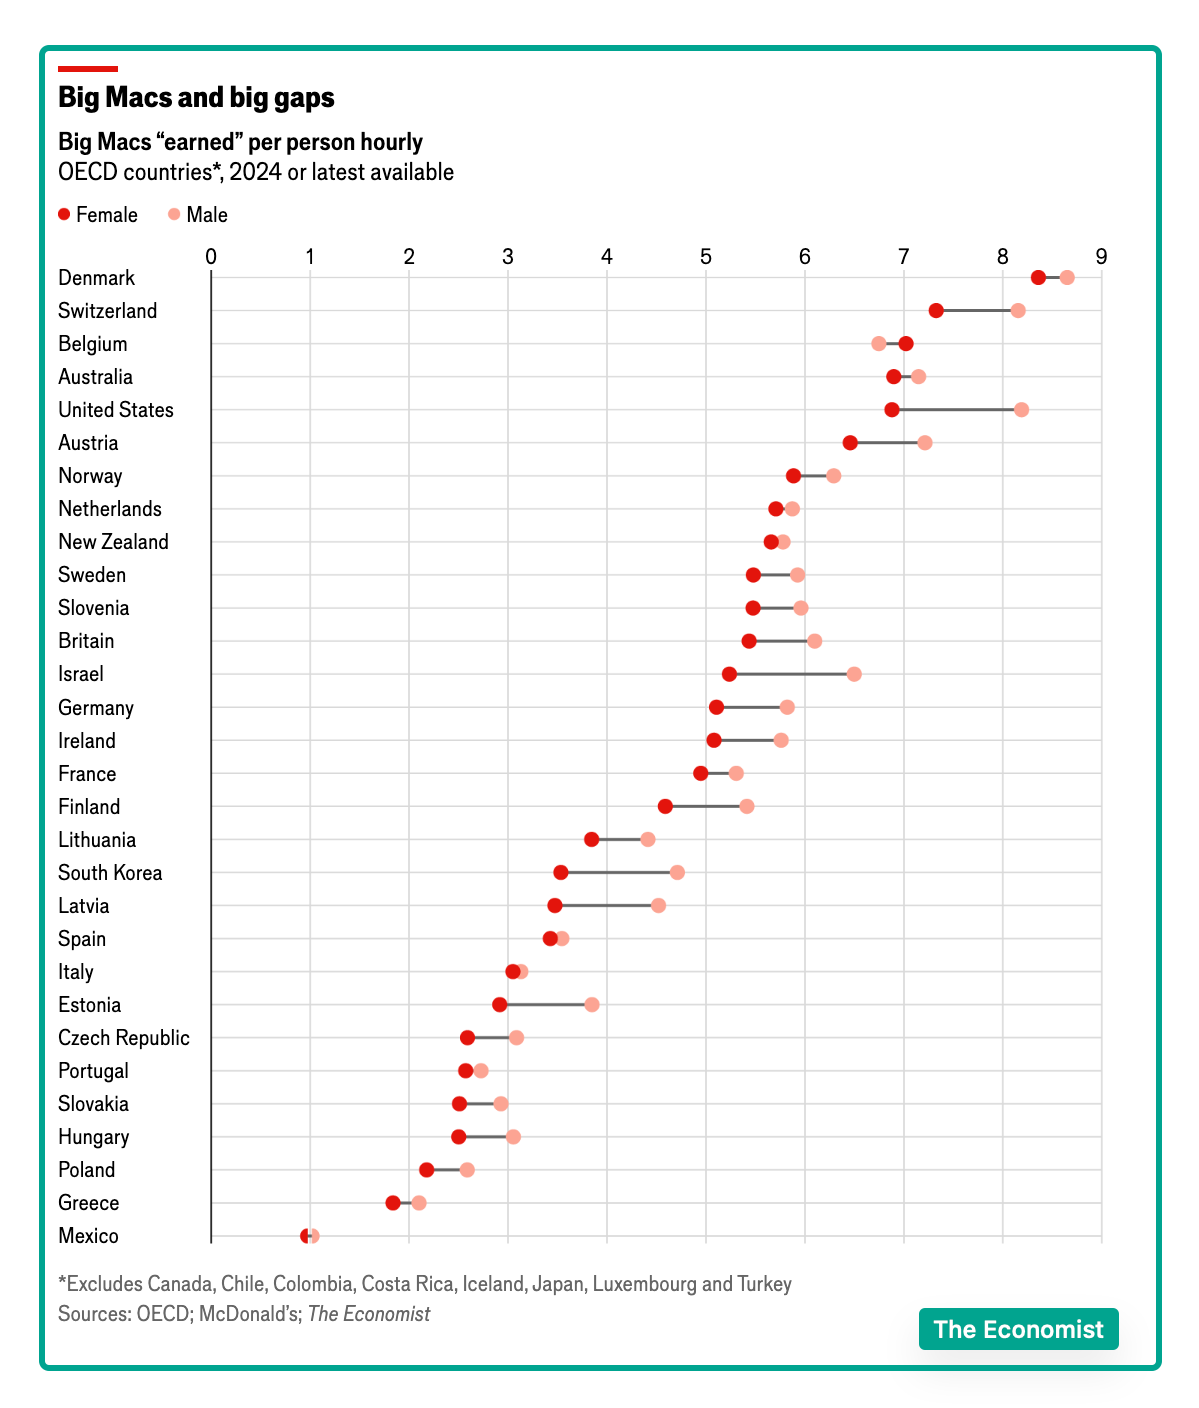
 However, the numbers change when we note that Americans work more hours. Then, seeing what an hour of work buys, the sequence shifts somewhat, especially including the gender wage gap. On a per hour basis, Denmark moves to the top with its hourly wage averaging 8.5 burgers. Meanwhile, between 7 and 8, Switzerland remains #2, the U.S. rank plunges, and Mexico is still at the bottom.
But the anomaly is Belgium where the women can afford more burgers than the men:
Our Bottom Line: Accurate Statistics
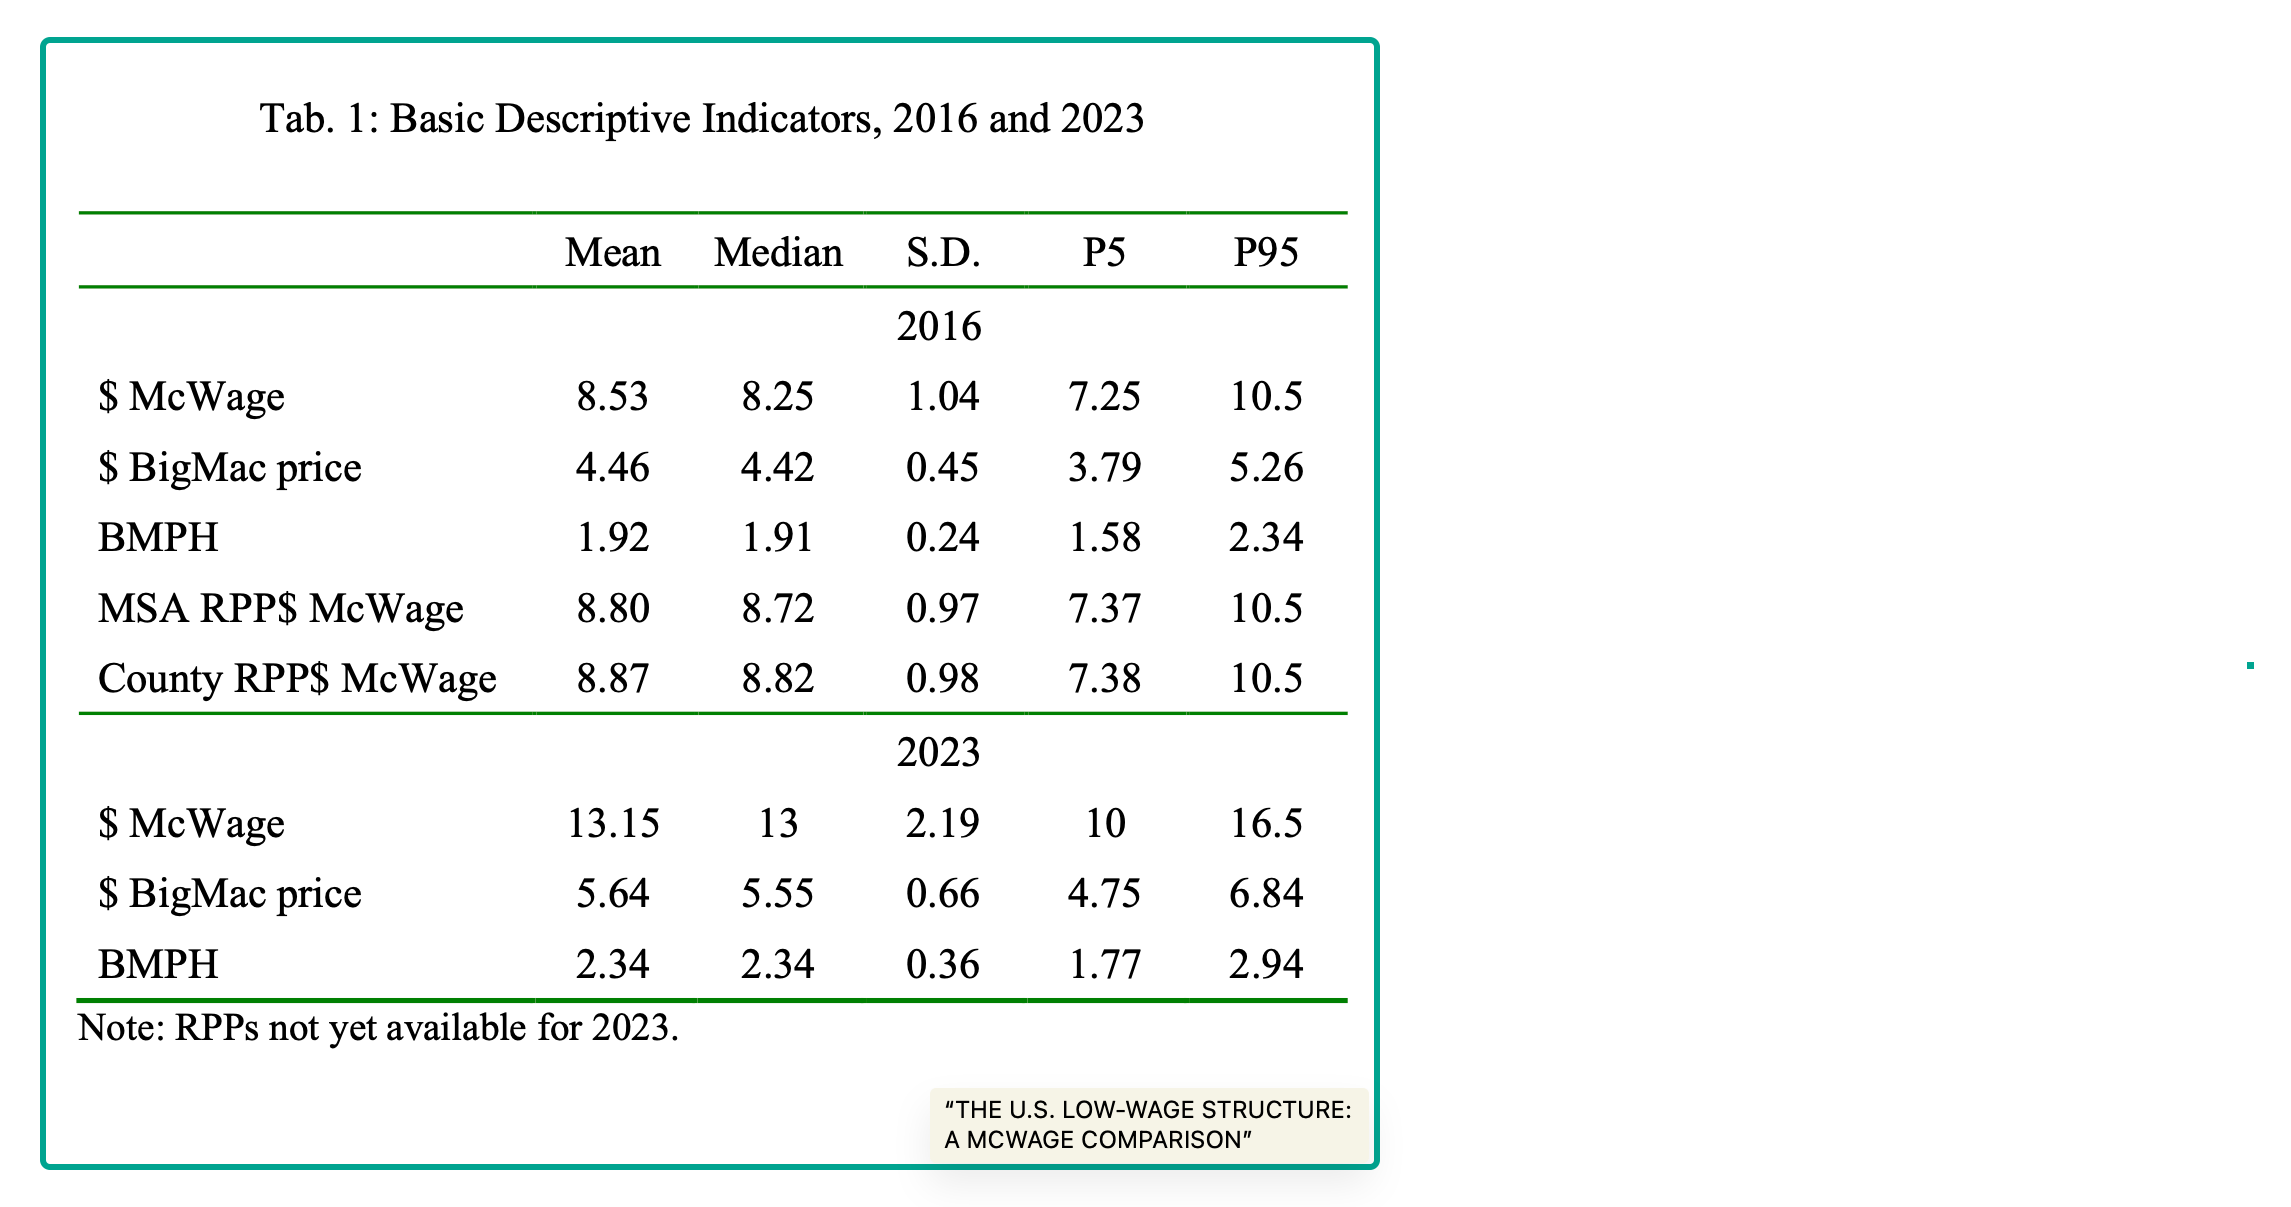
In a recent NBER study, scholars compared McWages for their “Basic Crew” in the United States. Again, they point out the comparison is possible because of a standardized job and identical product. (To check their data, they also gathered statistics from Starbucks.) We have a whopping wage difference of 39 percent from the bottom to the top U.S. state. Consequently, the BMPH (Big Mac Per Hour) gap from the 5th to 95th percentile is large too:
And below, researchers compare McWages and BMPH:
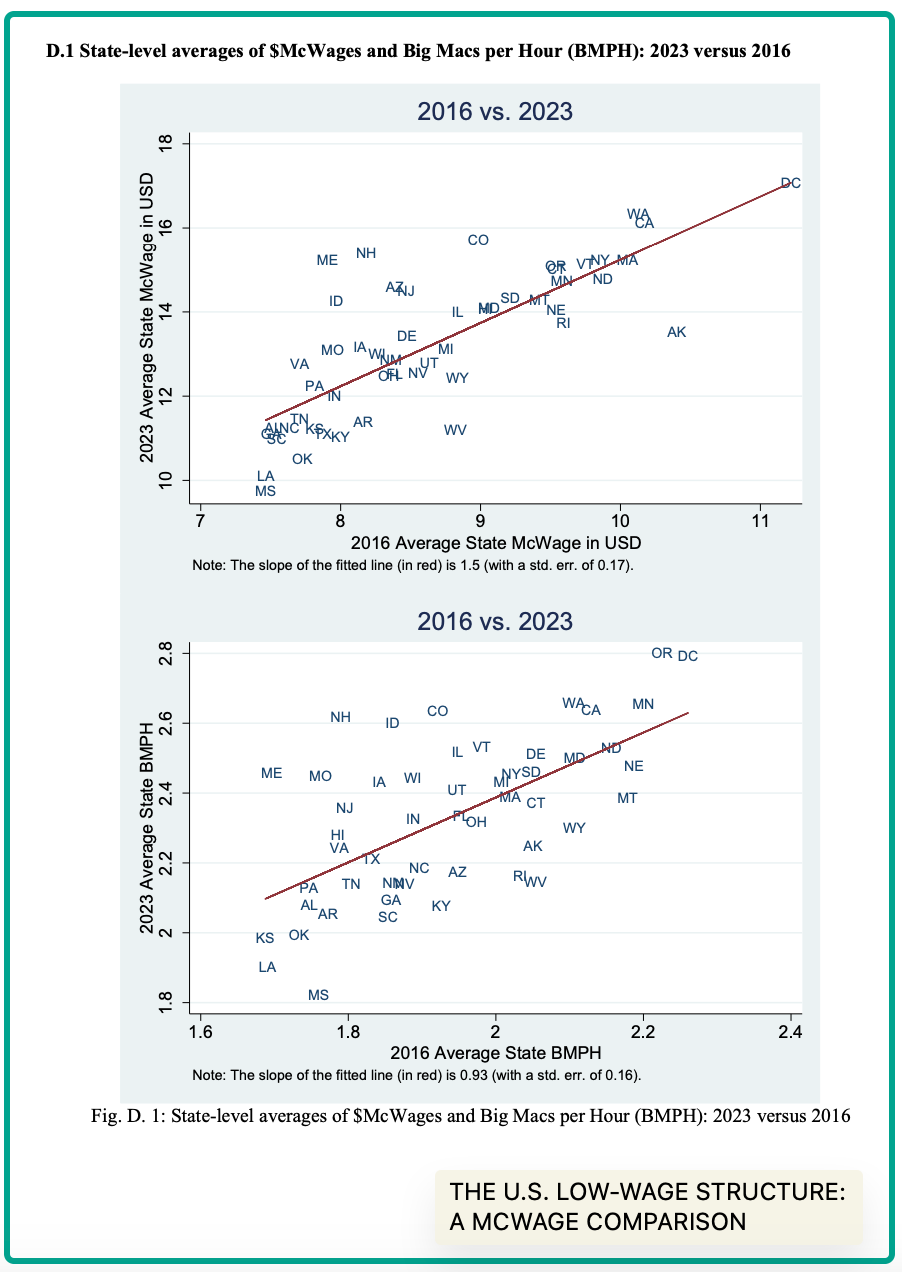
So where are we? Whether it’s Mexico or Mississippi, we see where low wages predominate and how many Big Macs they can buy. Beyond the Big Mac, we can move to this post about food prices and purchasing trends.
But most crucially, we appreciate this committment to accurate statistics.
My sources and more: It’s always fun to return to The Economist’s Big Mac look at economics. During August their focus was the McWage. Next, elevating our perspective, a professor emeritus at Princeton also took a look. In the table, RPP refers to regional price parity while MSA is Metropolitan Statistical Areas.


