How Skateboarding Took Us Closer to Gender Equity
September 13, 2021
When E-Cigarette Taxes Increased Smoking
September 15, 2021When a bridge spans two states, engineers need to use the same measurement system. Otherwise meeting in the middle could be a problem.
An attempt at statistical consistency started with Thomas Jefferson in 1807. It continues today.
Let’s take a look.
Statistical Consistency
Hoping to make the East Coast safer for shipping, Thomas Jefferson established the Survey of the Coast. He charted nearby waters and the coastline. The coastline also came in handy for calculating height.
And that is the problem.
At first we used the coastline to locate sea level. Next, we developed tide-related formulas that required adjusting in 1903, 1907, 1912, 1929, and 1988. More recently, tectonic plate activity and oil and gas exploration have changed elevations in the U.S. and perhaps its location on the earth. So, with more sophisticated computer, satellite, and GPS capability, we are again recalculating where we start to measure height.
Scientists have hypothesized that the Pacific Northwest has shrunk by as much as five feet and the toe of Florida, not even an inch. They believe that Seattle is 4.3 feet lower and Alaska might have sunk by six feet. As a result, our tallest mountains will be lower as might our skyscrapers.
These are the current estimates:

https://www.nytimes.com/2020/05/22/science/maps-elevation-geodetic-survey.html?action=click&module=RelatedLinks&pgtype=Article
As global warming melts glaciers and shrinks ice sheets, our planet’s mass moves from land to the ocean. From the change in sea level, we will again have the height of our mountains and cities shift. The shape of the earth will even change. The science is called geodetic leveling. NOAA (the National Oceanic and Atmospheric Administration) has been developing a state-of-the-art National Spatial reference System that will monitor a group of metrics that include height.
Our Bottom Line: GDP Consistency
From here, we can leap to the GDP. Like all statistics, it too can be inconsistent.
The GDP is the total dollar value of the goods and services a country produces in one year. To get the U.S. total of approximately $22.7 trillion (nominal, not inflation adjusted), we primarily add together what consumers, businesses and government spend. Then, subtracting imports from exports, we get our total.
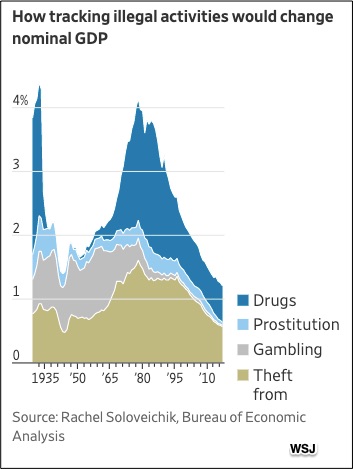
Somewhat like our bridge that needs to be measured the same way in two states, so too does the GDP. In the U.S., some state GDPs include marijuana and others do not. It all depends somewhat on where it is legal. Globally, many nations like the U.K. add illegal activity such as the production and sale of heroin to their GDP totals while the U.S. does not. However, in 2013, the U.S. decided to add items like research to the GDP whereas before it had been an intermediate item.
Statisticians estimated that illegal activities would have added more than 1 percent to the U.S GDP in 2017:

https://www.wsj.com/articles/gdp-doesnt-include-proceeds-of-crime-should-it-11575628201
Our point here is that seemingly precise numbers depend on a slew of subjective decisions. And yet, we tend to “treasure what we measure.”
My sources and more: Last May, the NY Times looked at the shrinking U.S. Then, I had to go back to 2019 to check on GDP differences but have up-to-date GDP totals. Also interesting, the best Mount Everest measuring story was in the NY Times.and also from Newsweek. Please note that today’s description of the GDP was in a previous econlife post.
![econlifelogotrademarkedwebsitelogo[1]](/wp-content/uploads/2024/05/econlifelogotrademarkedwebsitelogo1.png#100878)


