When you look at U.S. unemployment, first think 145,000 and 60,000. The jobs information comes from 145,000 businesses and government agencies, and from approximately 60,000 families. The businesses tell us about their payrolls. Meanwhile, the households survey lets us know who has a job and who does not, who works part time, and who was furloughed (and more).
Below, you can see how the BLS describes the Household and Payroll Surveys:
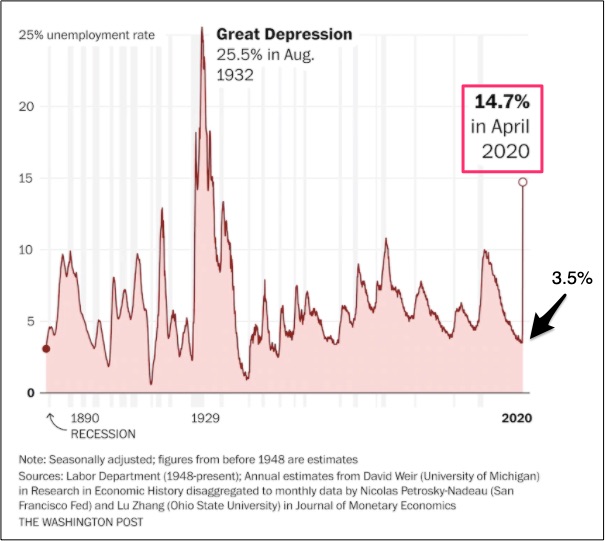
In the May 8th employment report, the two perspectives–businesses and households—created a picture of what happened to jobs markets in April. The report said the unemployment rate was 14.7 percent. But 14.7 percent does not tell us what really is happening.
So let’s take a look.
U.S. Unemployment
First, we can look back. We’ve just surpassed almost all unemployment rate records except for the Great Depression. However, the number of people who are currently unemployed far exceeds the past because our labor force, at 165 million or so, is so much bigger:
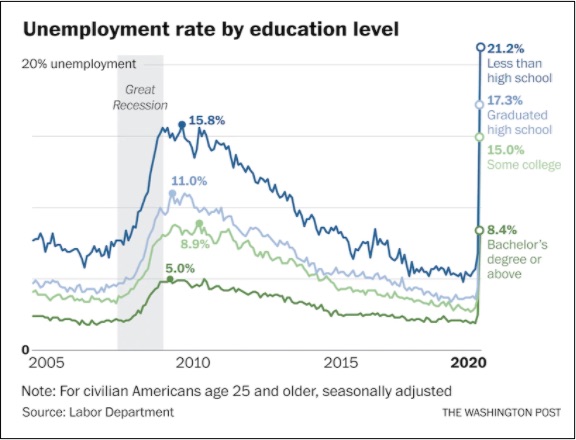
When we look at education, more of the picture becomes clear. You can see the highest unemployment rate among people with no more than a high school diploma:
The graph below could be summarized with the diffusion index. A measure of whether job losses are widespread, the diffusion index is lower when job losses are spread across a range of sectors. When the Index falls beneath 50 percent, it means that more industries lost jobs than gained them. During February it was 53.7. The April number was an eye-popping 4.8:
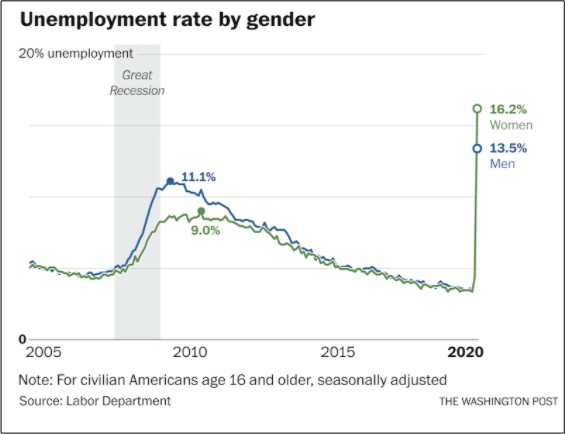
A higher proportion of women are unemployed:
Our Bottom Line: Disruption
A former commissioner of the Bureau of Labor Statistics said that by noting how the February jobs landscape had been disrupted during April, she could best picture the dismal situation. By disruption, she meant some of the following:
- Have a job but not at work
- Working part time
- Officially laid off
- Temporarily on leave
- And her lens did not even count those of us who are working from home and the individuals people who took pay cuts.
She concluded that 23.4 percent of all jobs were disrupted.
My sources and more: The Washington Post and fivethirtyeight, here and in a podcast, presented the real unemployment story. From there, the BLS press release and survey descriptions came in handy as did this Congressional Research Report on labor during the Great Depression.


