![econlifelogotrademarkedwebsitelogo[1]](/wp-content/uploads/2024/05/econlifelogotrademarkedwebsitelogo1.png#100878)


Some Tips About Tipping
October 1, 2019
The Unexpected Side of Library Late Fees
October 3, 2019
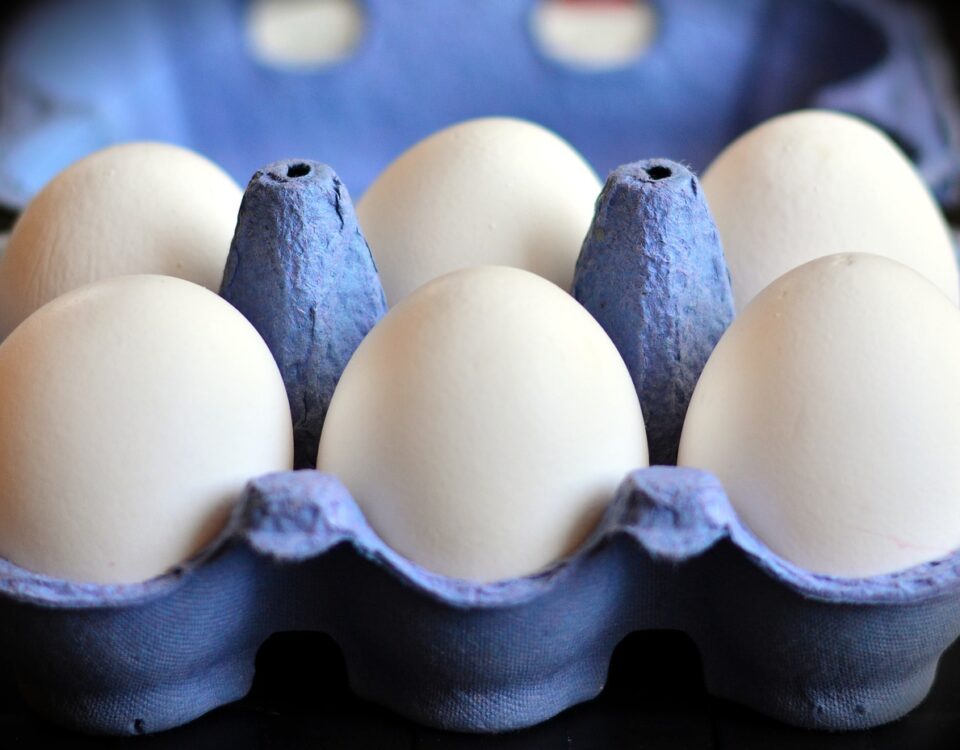
The U.S, has an egg glut.
Once you look closely it gets rather interesting.
Egg Glut Facts That Could Come in Handy
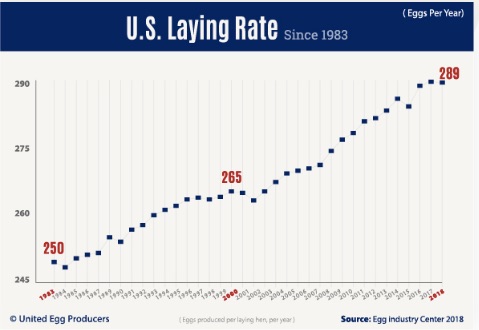
Hens are laying more eggs.
Averaging 289 a year, the average daily rate is 79 per 100 layers as of January, 2018. The United Egg Producers says the reasons include better nutrition, genetics, disease prevention, and flock management.
You can see the steady rise in hen productivity since 1983:
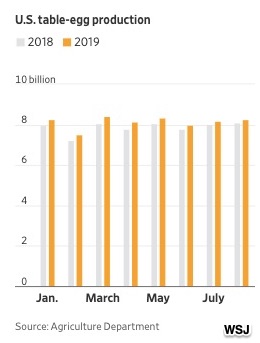
And, there are more hens.
Currently close to 331.4 million, the egg-laying hen population rose by 800,000 since last year (with each of those additional hens laying 289 eggs).
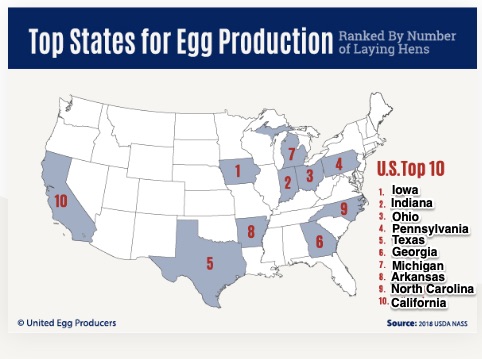
The most eggs come from Iowa. We can add Indiana, Ohio, Pennsylvania, Texas to get the top 5:
So you can see why each month we have more eggs than a year ago:
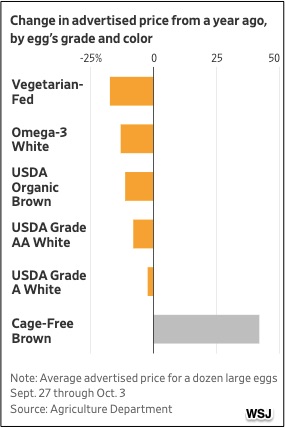
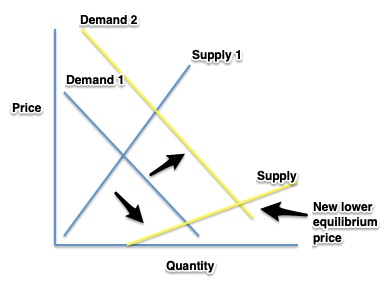
Our Bottom Line: Supply and Demand
The egg glut is classic economics. It takes us straight to supply, demand, and lower prices:
For a glut, it makes sense to think first of the supply side. And yes, on the supply side we do have more productive hens and many more eggs. However, at the same time, demand is up. With each of us averaging 279 a year, The Washington Post says we are experiencing a “resurgence of eggs.” It all began in 2016 when U.S. government dietitians started talking more favorably about cholesterol. I am not sure if we have causation but per capita egg consumption soared by more than 6% and has been rising ever since.
An economist might illustrate this egg glut through a graph with increases in supply and demand. She would need to be sure that the new supply curve’s slope created the price drop:
I wonder though if we will touch our 1945 peak. At 404, we were eating more than an egg a day.
My sources and more: Thanks to my friend Alexis for alerting me to the egg glut which took me to egg consumption and then to a vast array of egg-cellent facts.
