![econlifelogotrademarkedwebsitelogo[1]](/wp-content/uploads/2024/05/econlifelogotrademarkedwebsitelogo1.png#100878)


How Traffic Lights Relate to Adam Smith
July 16, 2018
Why We Need Speedy Connections
July 18, 2018
If you go back to 1997, Bill Clinton was President, Al Gore his V.P., and the Dow hit record highs when it topped 8,200. At the supermarket, a dozen eggs were approximately $1.17, a pound of bananas (maybe three) was $.50, and, for $4.59, you could have seen the top grossing movie, Titanic.
Yesterday the Dow was at 25,064.36 and those dozen eggs went up to approximately $1.80. As for the bananas, at $.58 a pound, they are still pretty cheap.
Today, let’s see where those price changes take us. When we look at what went up and down during the past twenty years, is there a message?
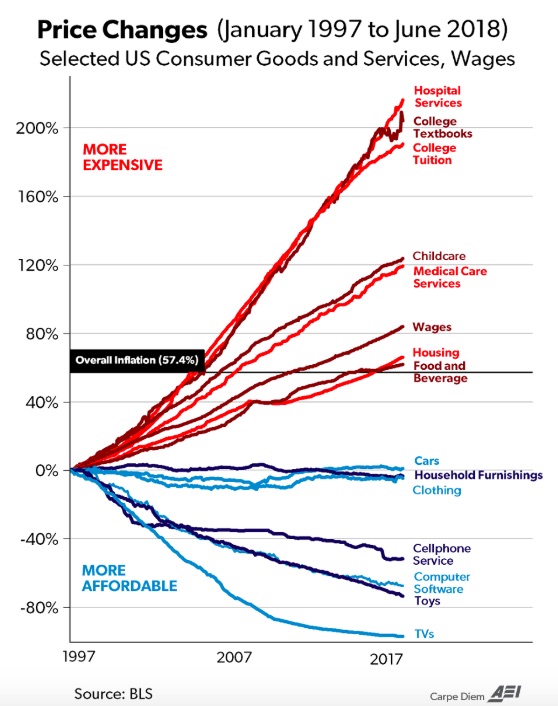
Twenty Years of Price Changes
While average prices have gone up slightly more than 57% during the past twenty years, certain categories of goods and services are cheaper. Dropping the most, TV prices were down a whopping 97%. Somewhat similarly, typical toys cost us 74% less and software was down 67%.
But you can also see that hospital services, and college expenses have soared:
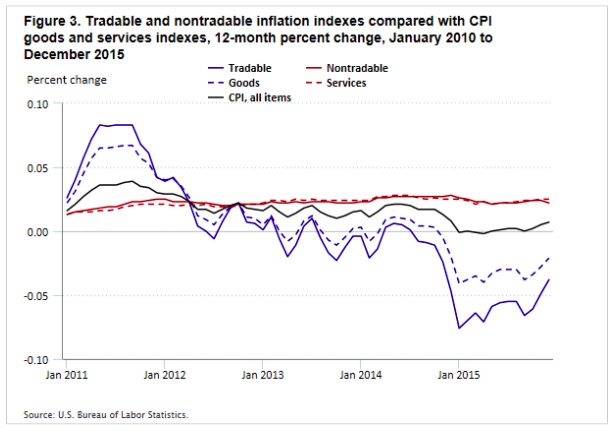
Our Bottom Line: Tradable Goods
The common denominator among most of the items with price declines is trade. Starting with a definition, let’s just say that a tradable good or service is sold away from its home country. Correspondingly, our nontradables remain where they were made.
In a recent paper, the U.S. Bureau of Labor Statistics (BLS) has divided the CPI into tradable and nontradable goods to compare their price trajectories. Their conclusion? During the past six years, tradable goods had a lower inflation rate than the nontradables. One reason is competition:
And returning to where we began, you can see in this BLS table that bananas (with a stable $.50 price) are tradables while eggs (with a price increase from $1.17-$1.80) are not:

So, where does this leave us? Knowing that a tariff is a part of the price for many tradables, our graphs could change soon.
My sources and more: Thanks to economist Mark Perry for providing the perfect focus for today with his “chart of the century.” Then, for prices, I went to these BLS series for specific items. However, I really started to smile after discovering this BLS paper with an inflation index for tradable and non-tradable goods and services.
Please note that the authors of the BLS paper expressed concerned that their time frame was just six years. They suggest further research in a number of areas.


