Using a Fat Tail to Describe Stock Market Risk
August 25, 2015The Data That Keep Track of Us at Work
August 27, 2015In “What If,” Randall Monroe’ tells us that people who earn the $7.25 minimum wage make a nickel every 25 seconds. Paid in pennies, they would have to drag home 30 pounds of pennies each day. Alternatively, if they received a mixture of loose change, it probably would fill up a plastic water bottle. And, if the change in that bottle rained down on them, they would not be injured but would be buried within an hour.
Where are we going? To the different ways we can look at the minimum wage.
Median Income
Although the $15 minimum wage hike that has been in the news sounds like a single number, it really isn’t.
Depending on a city’s median wage, $15 varies from place to place. In cities with a low median wage, a higher minimum wage will provide relatively more of an income boost. The downside though is that a relatively large increase in the median wage could result in job losses from automation, job elimination, and even an employer exodus.
Below, with Miami at the low end and San Francisco quite high, you can see how the median wage compares to a $15 minimum wage.

Cost of Living
Purchasing Power
Moving to the supply side of the labor market, we can see how spending power varies from state to state and even town to town.
From this perspective, a $15 minimum wage hike would most impact workers in green states.

No new data available for New Mexico
Still though the allocation (below) of the wage increase would be similar among all recipients.

From: The Atlantic
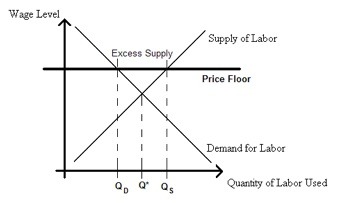
Our Bottom Line: Price Floor
Talking about a minimum wage, we can always draw a price floor. Ignoring a market based equilibrium, a price floor takes price higher to where quantity supplied will exceed quantity demanded. As a result, we have shortages that some economists say are minimal.
A Price Floor
Like Great Britain’s coastline, the closer we look at a $15 minimum wage hike, the more indents and zigzags we see.
![econlifelogotrademarkedwebsitelogo[1]](/wp-content/uploads/2024/05/econlifelogotrademarkedwebsitelogo1.png#100878)


