![econlifelogotrademarkedwebsitelogo[1]](/wp-content/uploads/2024/05/econlifelogotrademarkedwebsitelogo1.png#100878)


What We Can Learn From Used Car Prices
March 17, 2021
How Covid Affected College Applications
March 19, 2021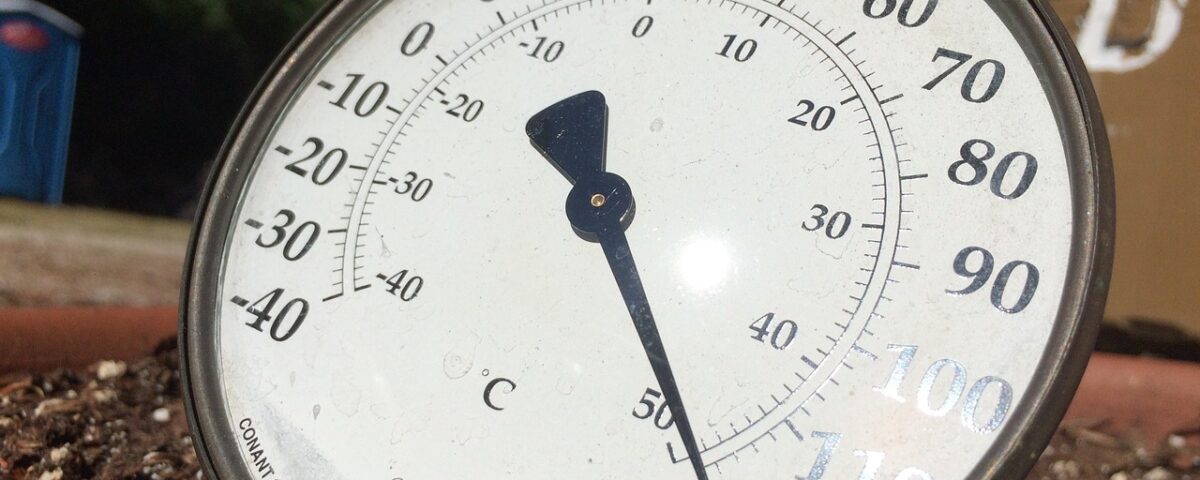
We could call 58.3°F the Goldilocks temperature. It’s not too hot, not too cold, but just right.
An IMF paper explained why we need to know this.
Electricity Use
The study
In a recent working paper, an IMF economist hypothesizes the connection between the demand for electricity and the temperature. Using satellite night light images, he quantifies global electricity use for 166 countries. Then, from the University of Delaware, he accesses temperature data. Combining the two, through hundreds of thousands of data points, he concludes that we diminish our demand for electricity as the temperature gets closer to 58.3°F. If we are on the colder side of our curve, then warmer temperatures require less heat. Meanwhile, in hotter climates, as temperature climbs we want more air conditioning.
At 14.6°C (58.28°F), the low point on the graph is where we could want the least electricity for heating or cooling:

Regions of the world differ because our demand for electricity also depends on whether our locality is rural or urban, residential or industrial. Since rural and residential areas are more sensitive to temperature changes, they tend to want more electricity when temperature rises. Meanwhile, urban and industrial regions tend to be less sensitive to temperature change.
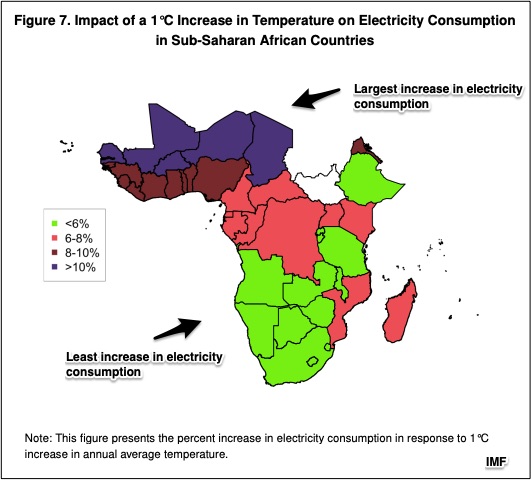
Sub-Saharan Africa
As the world’s hottest region, with 24°C its average temperature, Sub-Saharan African starts at a higher point on our curve. If, as Nobel economics laureate William Nordhaus predicts, we have a 1°C increase from 2010 to 2050, then the area’s rise in electricity demand could be 6.7%. Consequently, as the author of the IMF study concludes, Sub-Saharan Africa is most vulnerable to climate change:
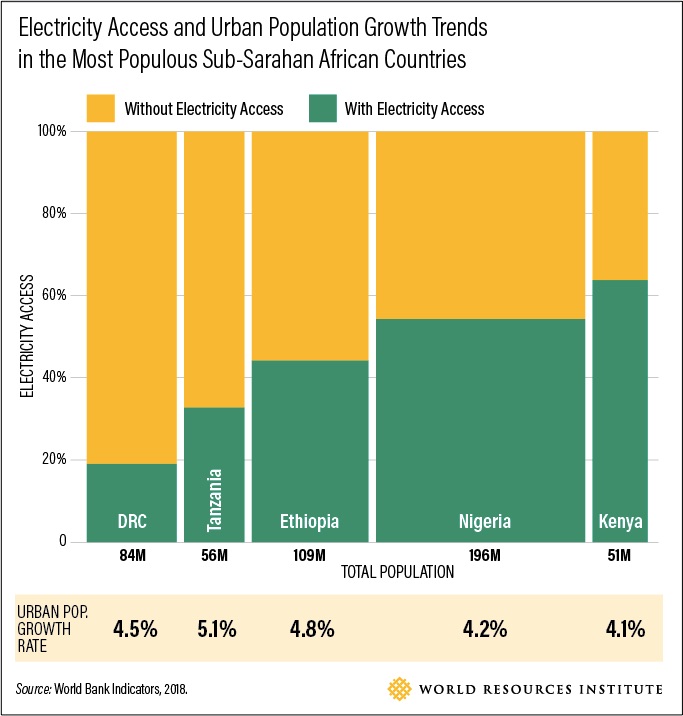
Our Bottom Line: Electricity Access
According to a World Bank (2020) estimate, by 2030, 85 percent of the people without access to electricity would be in sub-Saharan Africa:
So, for Sub-Saharan Africa and indeed all regions of the world, we are left remembering that 58.3°F is about more than the weather. It tells us how we could respond to climate change.
My sources and more: This IMF blog grabbed me. It took me to this working paper on electricity and temperature. Then, reading about Sub-Saharan Africa, I wound up at the World Resources Institute and then this World Bank report. It also returned me to our econlife look at U.S. energy at Lawrence Livermore Lab.

