![econlifelogotrademarkedwebsitelogo[1]](/wp-content/uploads/2024/05/econlifelogotrademarkedwebsitelogo1.png#100878)

How Cookout Costs Have Climbed
August 16, 2026
What We Can Learn From a Pork Cutlet
August 18, 2026
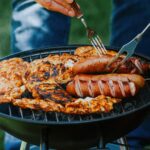
Recently, we considered the cost of a summer cookout by seeing what we spent.
But there is much more.
Comparing Spending and Wages
The Economist decided that a summer cookout for four adults would include ground beef, steak, Coca-Cola, and 7 other items:
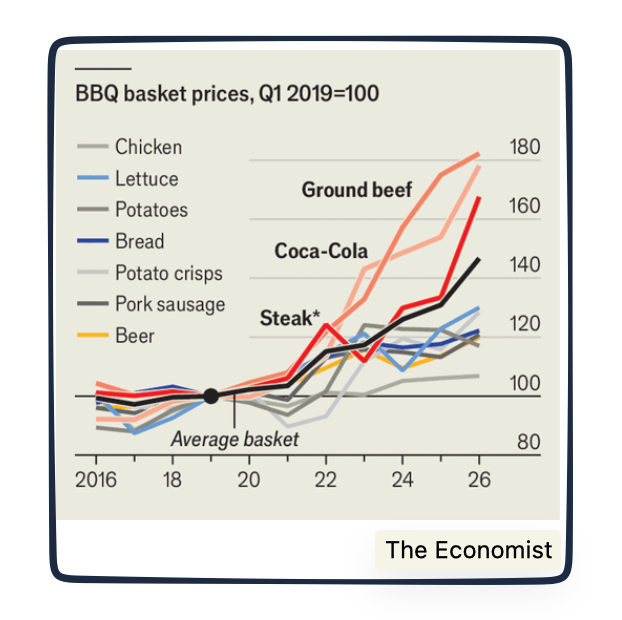
Since 2020, climbing at a 30 percent rate, grocery prices are up by close to $1,600. Still, though, because wages increased more than spending for several years, we could work less to buy more and even say that the BBQ basket was less expensive.
But it did not last.
Soon after, as wage increases fell, we had to work extra minutes to pay for our groceries.
Below you can see that wages outpaced spending from 2016 to 2021, and then it all reversed:
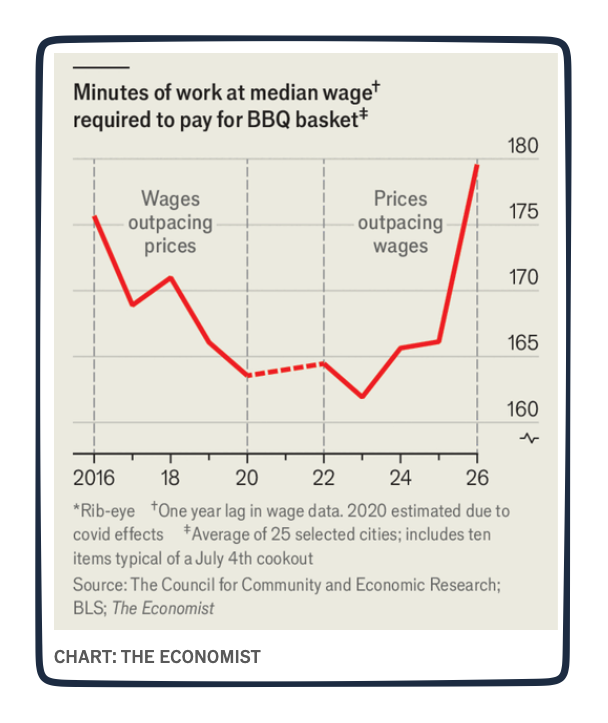
According to The Economist’s calculations, comparing 2020 to 2026, many of us will have to work 16 minutes more to pay for our summer BBQ.
Geography
Although food prices tend to be similar across the United States, wages might not be. Consequently, where you live can make a difference.
Having looked at 25 U.S. cities, The Economist concluded that a Las Vegas or Miami summer cookout could be less affordable than Seattle:

Our Bottom Line: Affordability
When we compare spending and wages, we are just looking at the purchasing power that determines affordability. For our cookout data, we needed to divide a wage by the price of a good or a service to indicate our purchasing power. From there, affordability rises or falls.
Below, I’ve leaped from BBQ to gasoline. Using ChatGPT, we can see this year’s plunge in our purchasing power between 2025 and now.
2025:

And, for now:
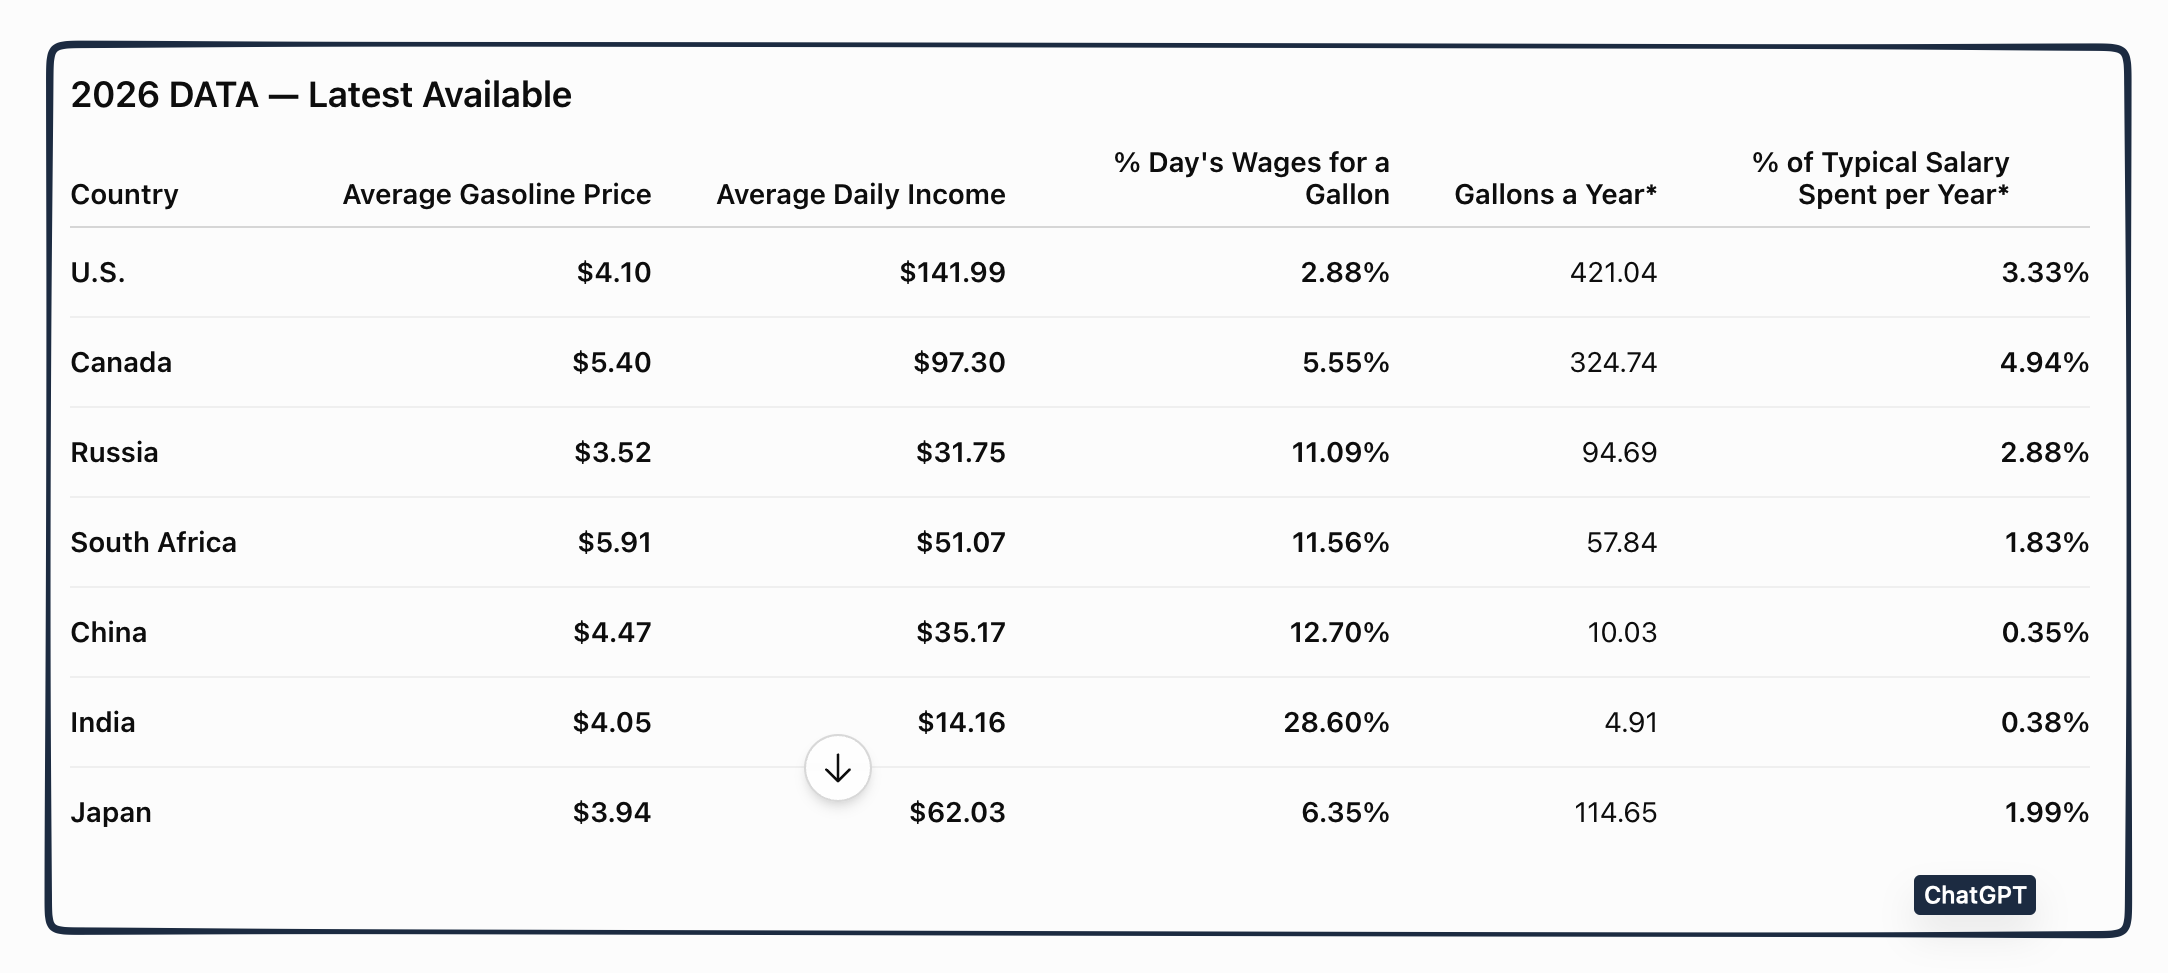
Please note that, when I checked the ChapGPT numbers, they varied. But still, with sufficient accuracy, they displayed today’s main idea. Whether it’s a cookout or the gas pump, affordability (based on purchasing power) depends on prices and wages.
My sources and more: Most of today’s facts came from The Economist’s BBQ index. Also, though, for more we can go back to their McWage Index for an international look at purchasing power and this NBER working paper. Then, beyond food, this Bloomberg summary of gasoline prices came in handy. And finally, I suggest concluding with this website for analysis that differed from The Economist.