![econlifelogotrademarkedwebsitelogo[1]](/wp-content/uploads/2024/05/econlifelogotrademarkedwebsitelogo1.png#100878)


The McDonald’s Coca-Cola Connection
June 15, 2026
Looking at the Links in the Oil Supply Chain
June 17, 2026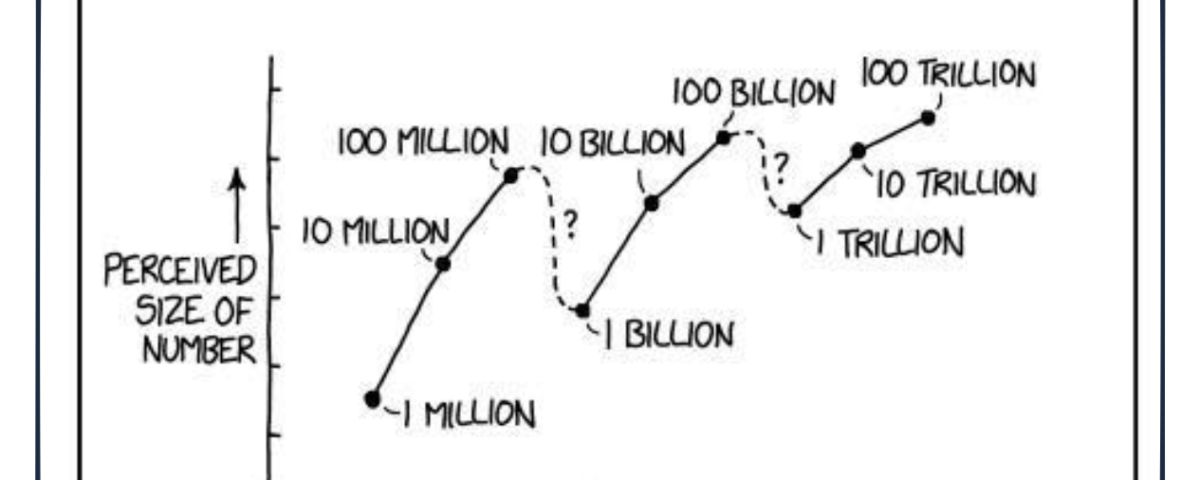
Hearing that the SpaceX IPO made Elon Musk a trillionaire, most of us don’t quite realize the size of the number.
Imagining a Trillion
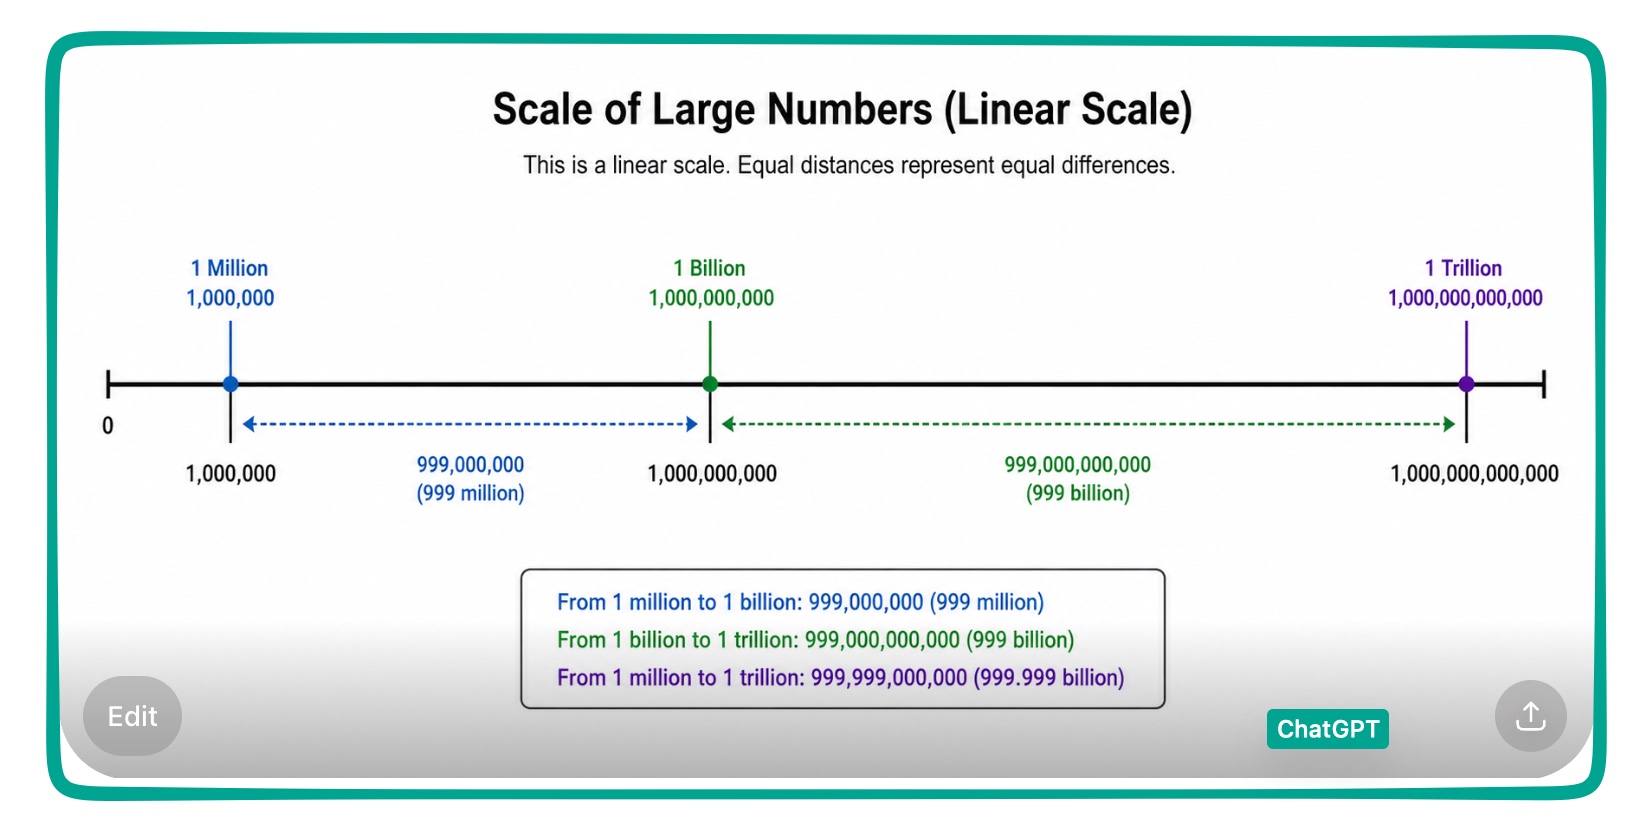
If you placed a billion at the halfway mark from a million to a trillion, you would be understating the distance from a billion to a trillion. Between the two we have to take a huge leap. For that reason Elon Musk’s recent bump in wealth takes him far beyond Jeff Bezos’s fortune estimated to be as much as $284 billion.
On the following scale, Bezos would be positioned closer to you and me than to Musk:
In Seconds
Comparing a million, a billion, and a trillion seconds takes us back to the Ice Age. Every two weeks or so, we live through slightly more than a million seconds. Meanwhile, dating to 1994, a billion seconds tick for almost 32 years. However, it’s a trillion that’s the gob smacker. Then, we are talking about millennia. The time we need for one trillion seconds to pass could be 32,000 years.
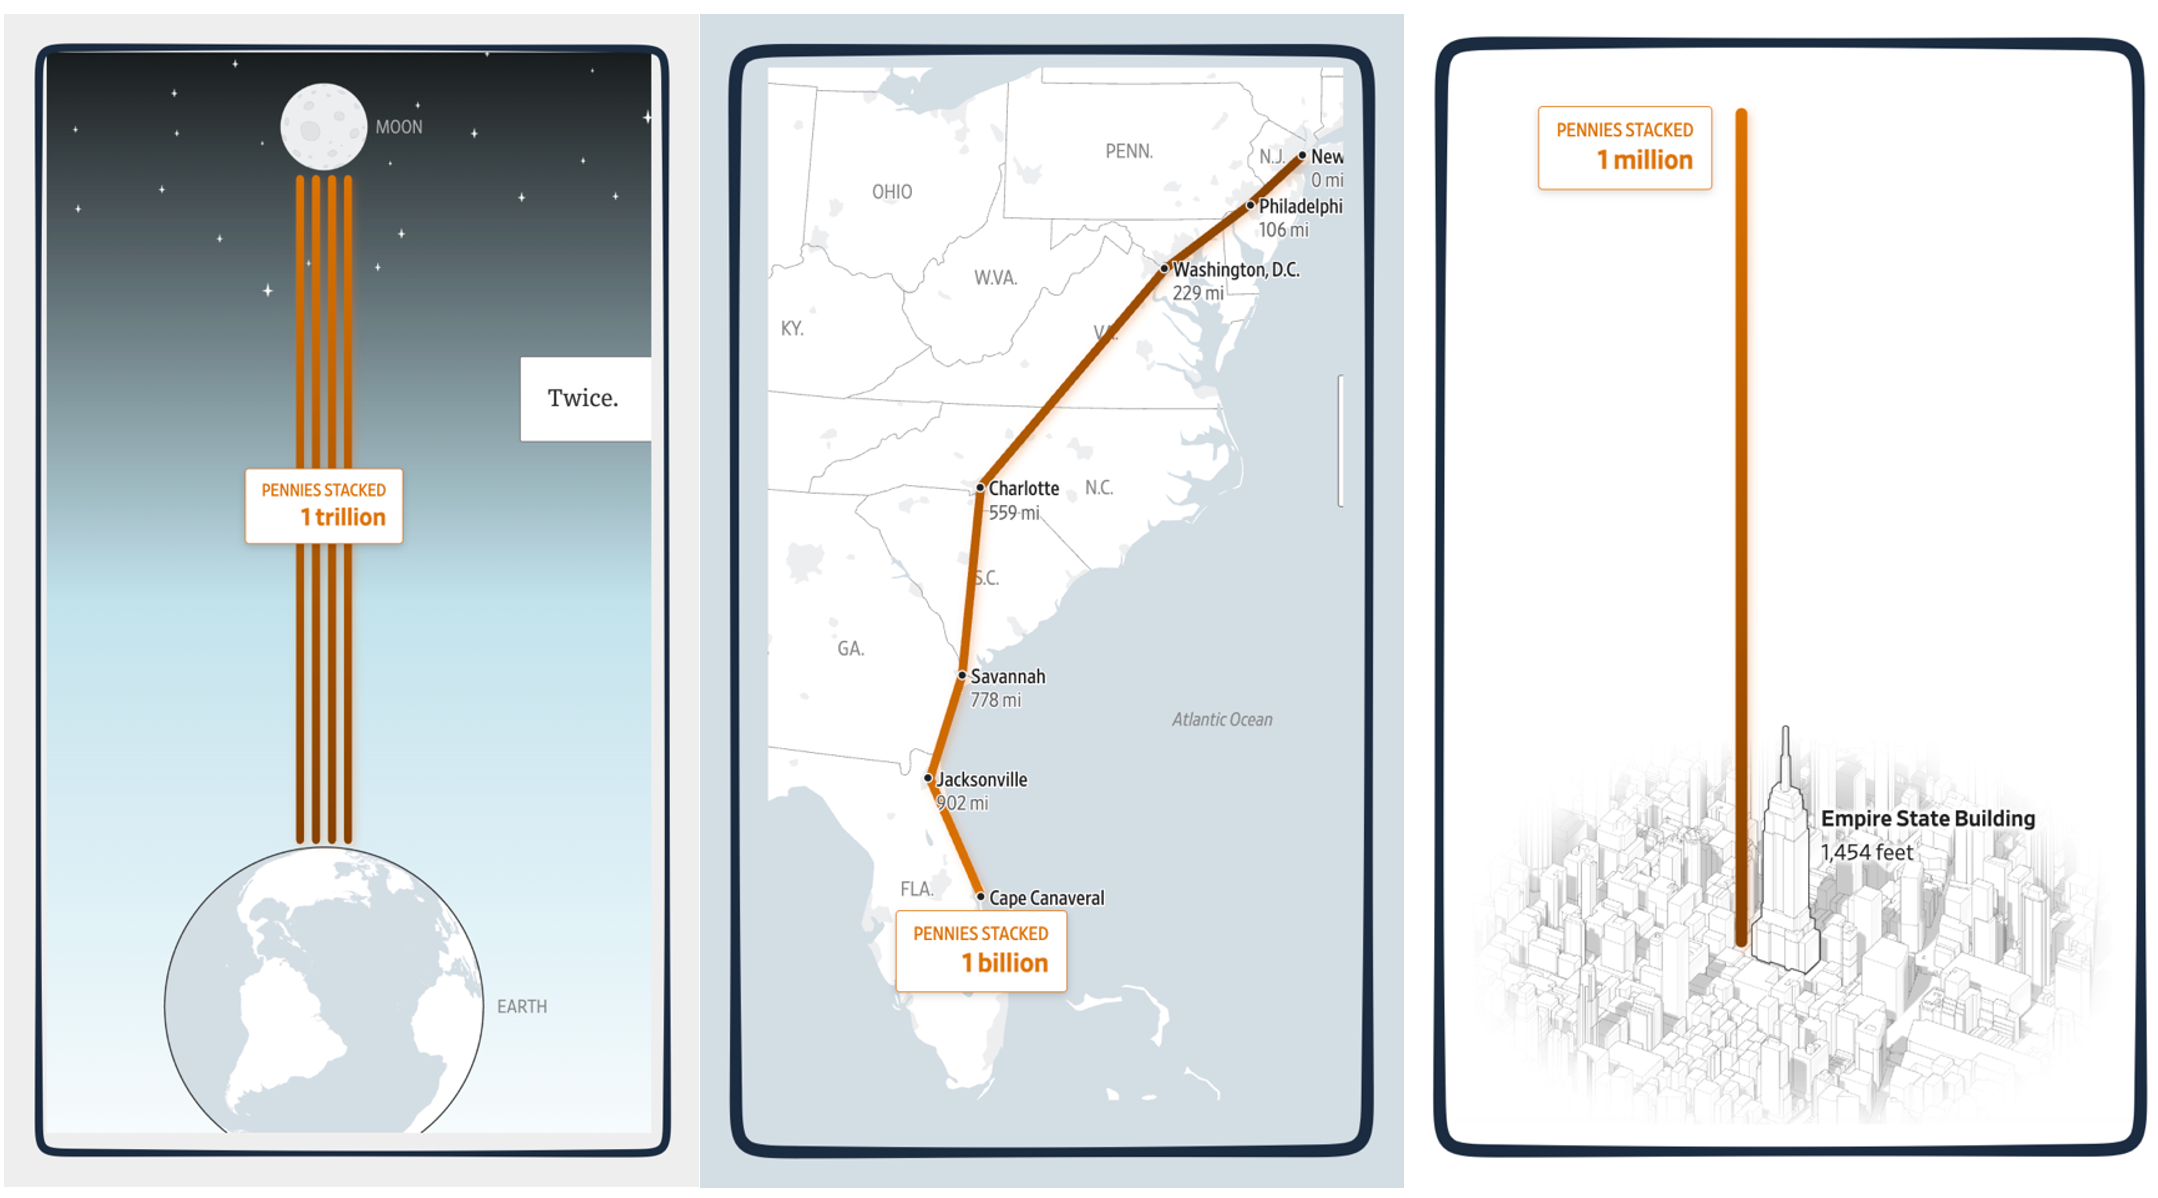
In Pennies
Viewed differently, a million penny pile is a mile high, and, at 1,000 miles, a billion pennies would connect New York to Cape Canaveral. But again it’s one trillion that requires the whopping stack that lets us travel to and from the moon twice.
The Wall Street Journal created the ideal graphic:
So yes, it can be interesting to ponder Elon Musk’s wealth. However, the U.S. budget affects us much more directly.
The Budget’s Big Numbers
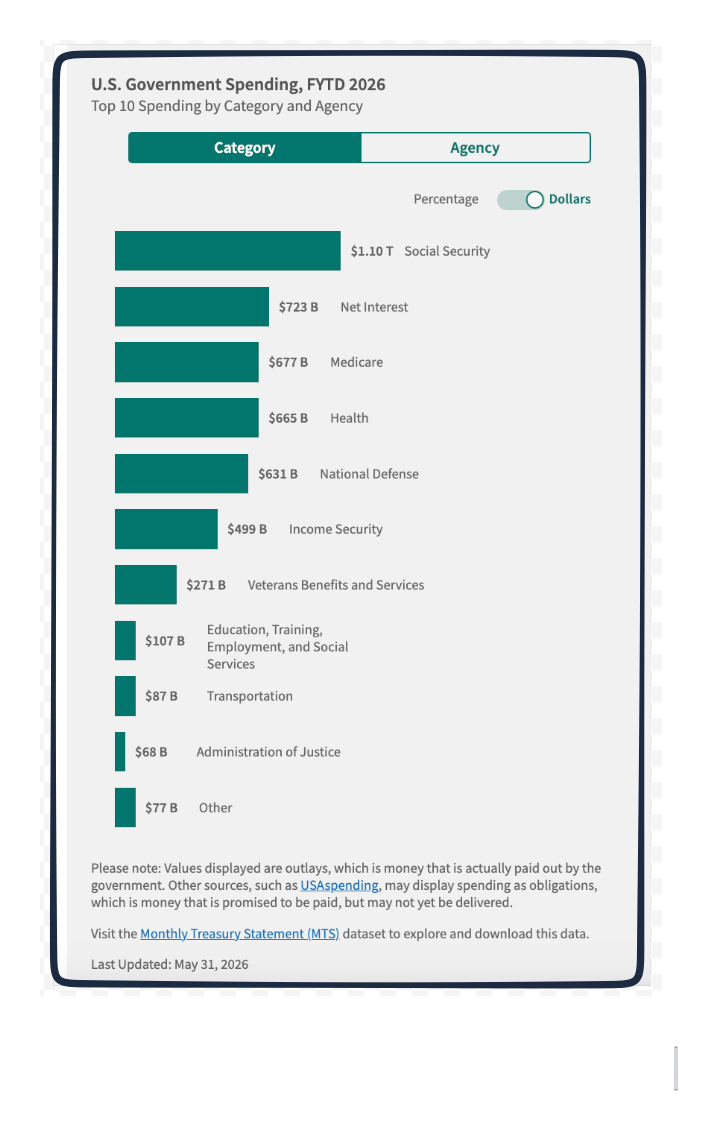
Thus far this year, the U.S. has spent $4,901,851,413,144.
If current spending is $4.9 trillion, how to compare it to defense spending of $631 billion?
Actually, $4.9 trillion is the same as $4,900 billion. Once we see everything in billions, some comparing is possible.
So when we are told that the President has proposed adding close to $590 billion to previous military spending, we can compare it to an entire budget that is approximately $5,000 billion:
 Our Bottom Line: Information Architecture
Defining architecture as structure, behavioral economists tell us that the structure of our information determines our understanding. And our understanding shapes our behavior.
In a paper on information architecture, scholars looked at retirement savings. When people were told that they could wind up with $5,000 a month or a total of $1 million, their saving behavior differed. Actually though, both were roughly equal since $1 million had a (typical annuity) return of $5,000 a month. However, what they were told–the information architecture–shaped their behavior.
Similarly, as voters, most of us are just not sure how trillions relate to billions. We need the appropriate information architecture to evaluate spending.
My sources and more: Thanks to the Wall Street Journal and Yahoo!Finance for helping us understand the gob smacking size of a trillion. From there, the U.S. Treasury spending site is always handy for data.
Please note that several of today’s sentences were in a past econlife post.


