![econlifelogotrademarkedwebsitelogo[1]](/wp-content/uploads/2024/05/econlifelogotrademarkedwebsitelogo1.png#100878)


What We Need to Know About a Shutdown
October 1, 2025
All We Need to Know About Halloween Candy
October 3, 2025
Asked what we spend our money on, most of us could have the same answer.
However, that is where the similarities end.
It all depends on the year and our age.
Household Spending
Most of us allocate our income between saving and spending. And, when we spend, it’s usually for housing, food, clothing, transportation, healthcare, education, and entertainment.
Viewed as one group in 2022, all households spent the largest slice of their income on housing and the smallest on education:
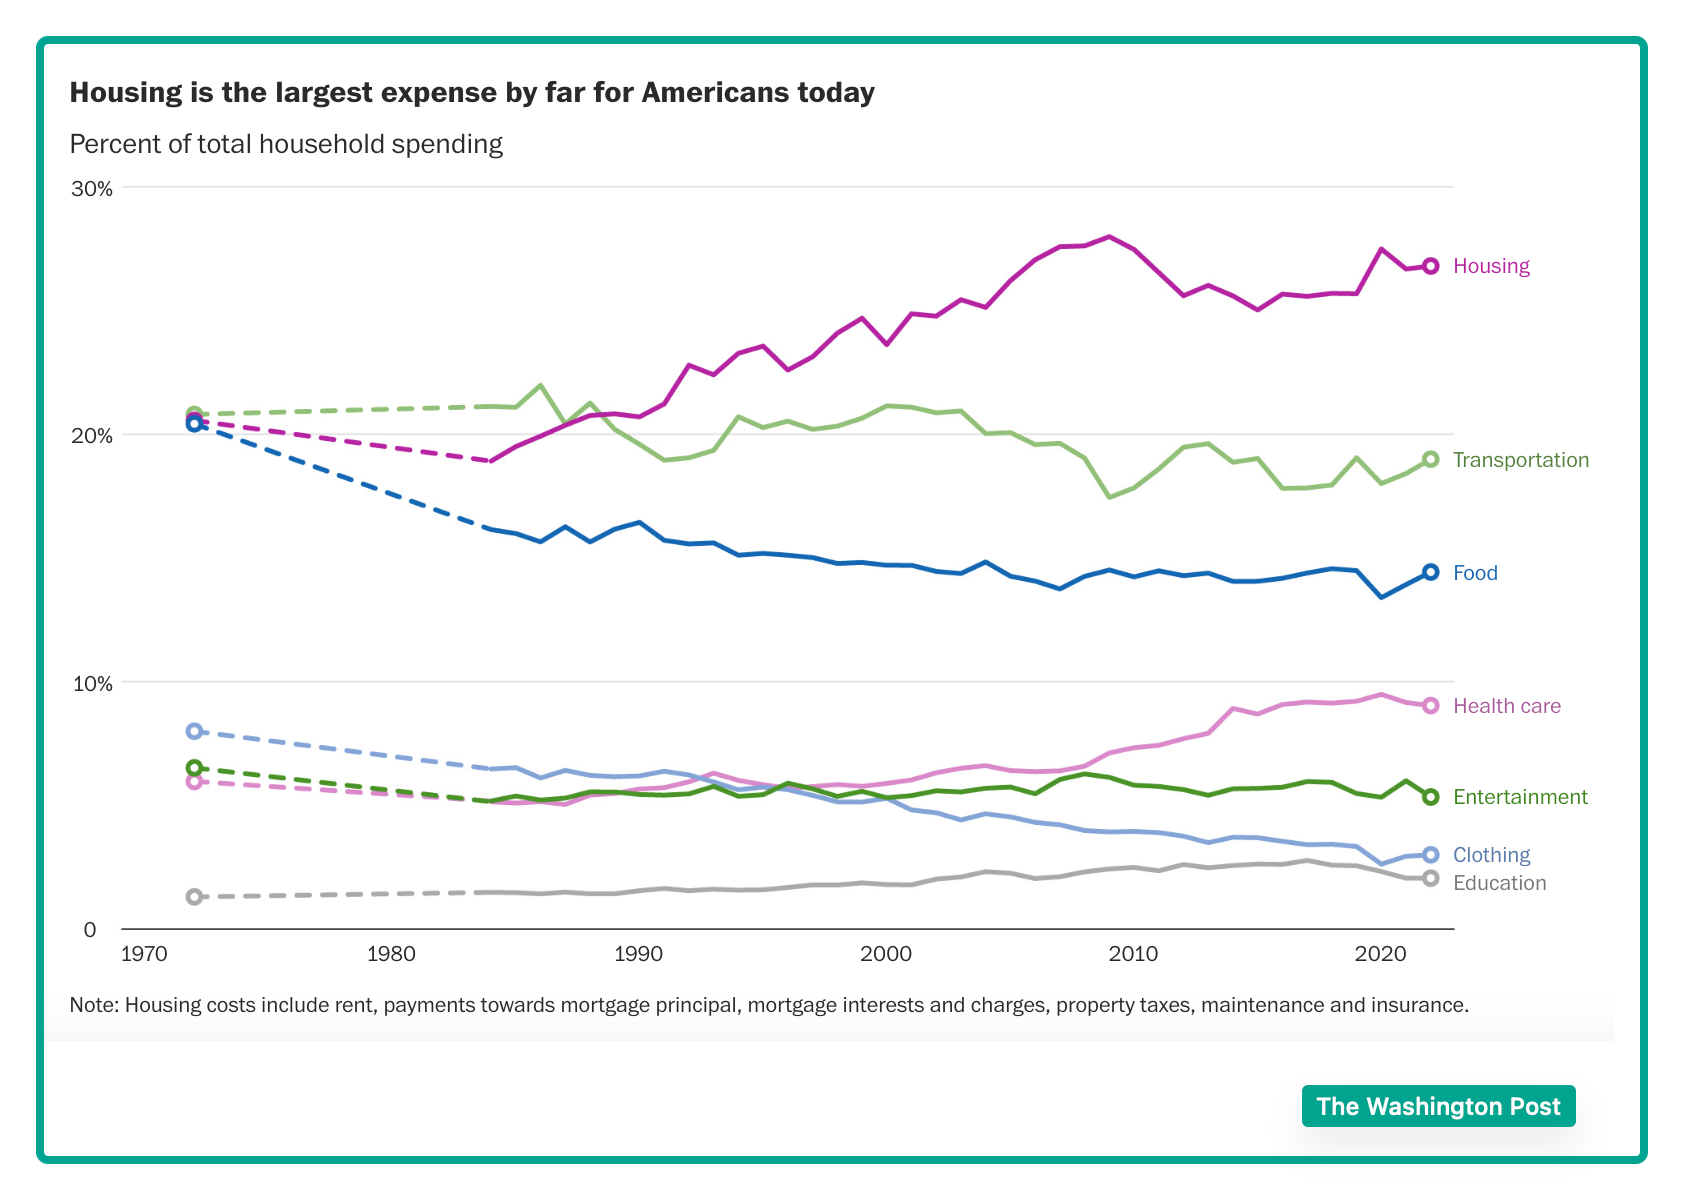
By contrast, in 1972, we allocated more to transportation than housing and more on clothing than healthcare. After that though, at 27%, housing moved into the top spot and healthcare pulled ahead of clothing and entertainment.
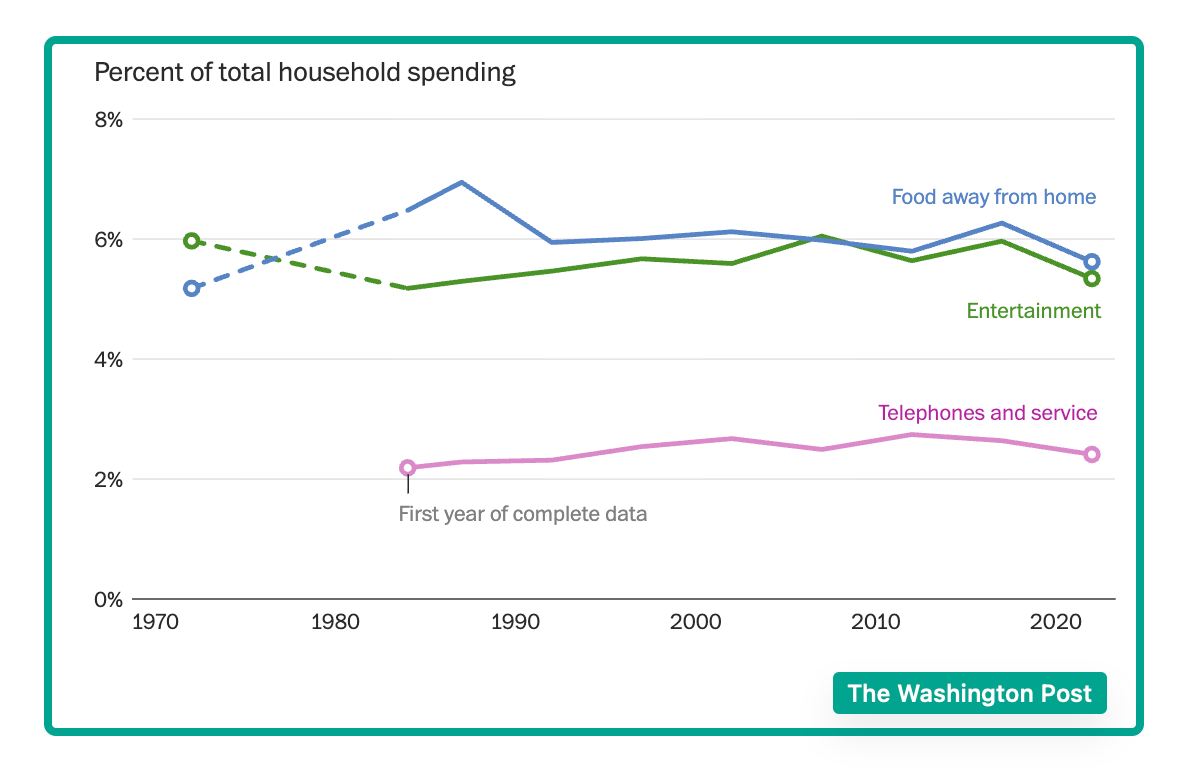
But still, the chunk of income we allocate to eating out, entertainment, and phones has been remarkably consistent for the past 50 years:
 And age matters.
In 1972, today’s 50-year-old household heads would have spent 20% of their money on housing rather than 2022’s 27%. By contrast, food would have slid from 21% to 15%.
During the same 50 years, as a 65-year-old baby boomer household head, I would have shifted up from 18% on housing to 25% and down from 20% to 14% on food.
And, for today’s 26-year-old household head, we can compare a 24% to 29% rise in our housing outlay and a 17% to 14% drop for food.
So yes, for everyone, housing up and food down. But when we look at our age, we can see the differences.
Our Bottom Line: Consumption Expenditures
A closer look reveals some changes. More often now, we go out for dinner instead of lunch and of course, replaced by cellphones, the landline is disappearing, and we have computers. In addition, families have fewer children and more grandparents while more of us have college degrees and live with our parents longer.
Still, we can always explain (and blame) everything on supply and demand. With housing pricier, inadequate supply is the culprit. Meanwhile, remaining on the supply side, food is relatively cheaper because farms are more productive. Also, demand played a role as our tastes shifted away from more expensive beef to produce and prepared food.
But whereas tech made food cheaper, it elevated healthcare expenses.
So, where are we? Maybe we can end with the consumption component of the GDP. Close to a whopping 70% portion of GDP, household spending (excluding the new homes that are counted as GDP investment) has been a substantial propellant of our economic growth.
My sources and more: Thanks to The Washington Post for creating a comparison website that had all of today’s facts.


