![econlifelogotrademarkedwebsitelogo[1]](/wp-content/uploads/2024/05/econlifelogotrademarkedwebsitelogo1.png#100878)


Just Ask Jenna Looks at Lacrosse and Human Capital
October 23, 2025
October 2025 Friday’s e-links: A Substack About Nothing and Everything
October 24, 2025
Let’s say you moved from Houghton, MI to Richmond, MO. Although your diet remained the same, your GHG emissions will soar.
This is the story.
Carbon Hoofprints and Footprints
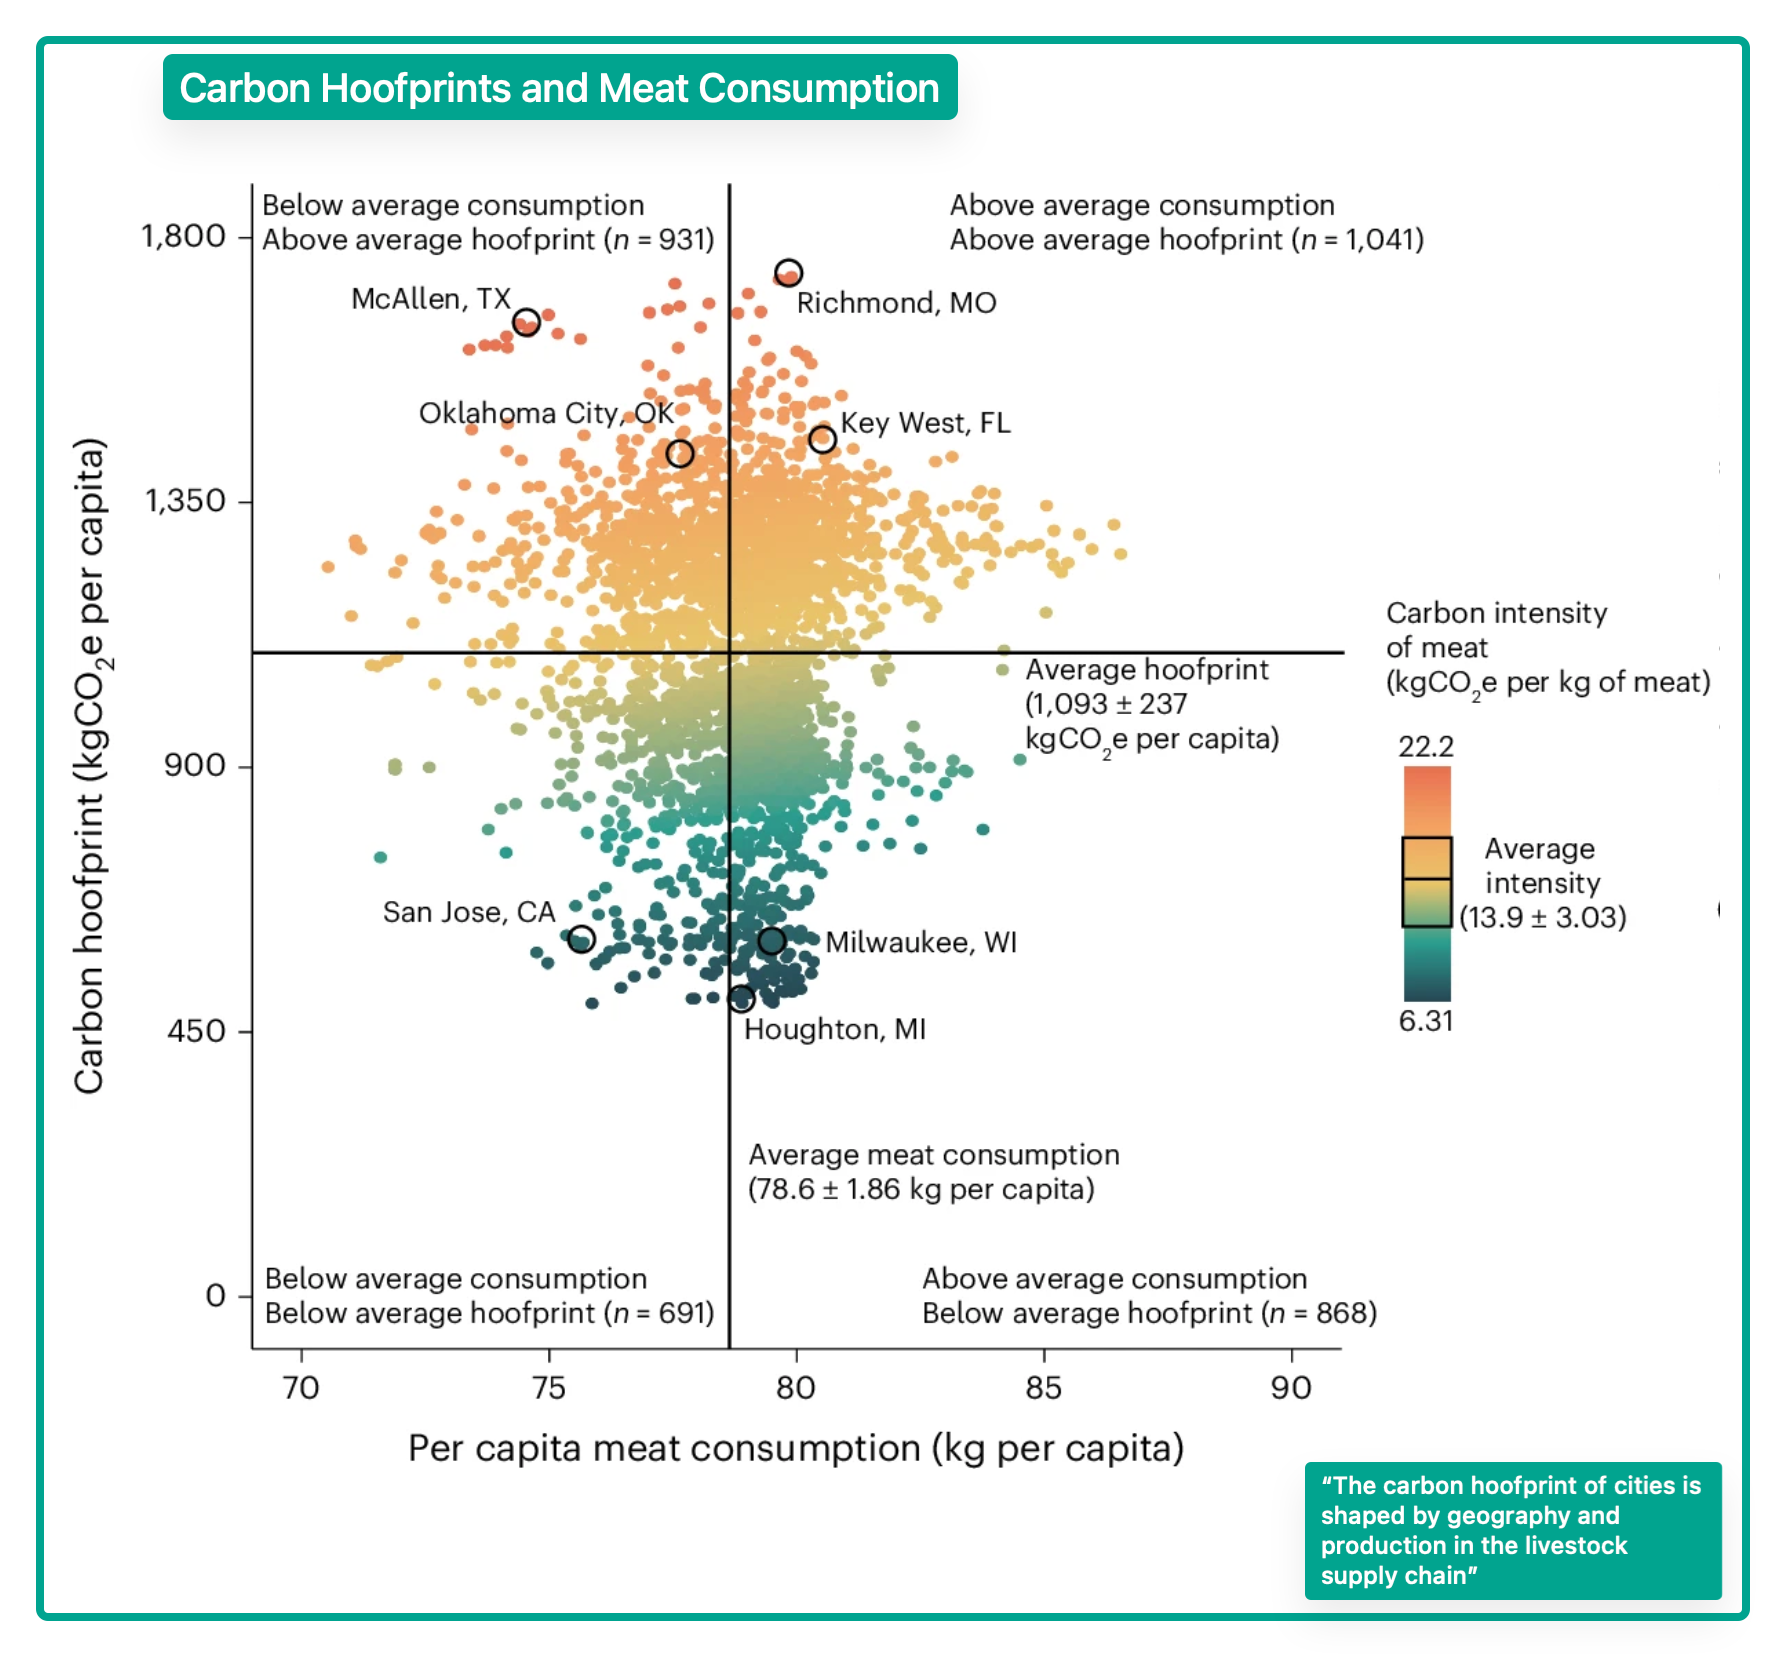
Researchers recently used a new approach to measure per capita GHG emissions. To calculate their numbers, they identified supply lines and consumption patterns. Comparing 3,531 cities, they looked at what we eat and where it came from. Then, by linking supply chains to urban consumers, they concluded that what you eat minimally matters. Instead, what counts is where your meat comes from.
What we eat
Our GHG footprint mainly comes from meat and dairy products.
Where it comes from
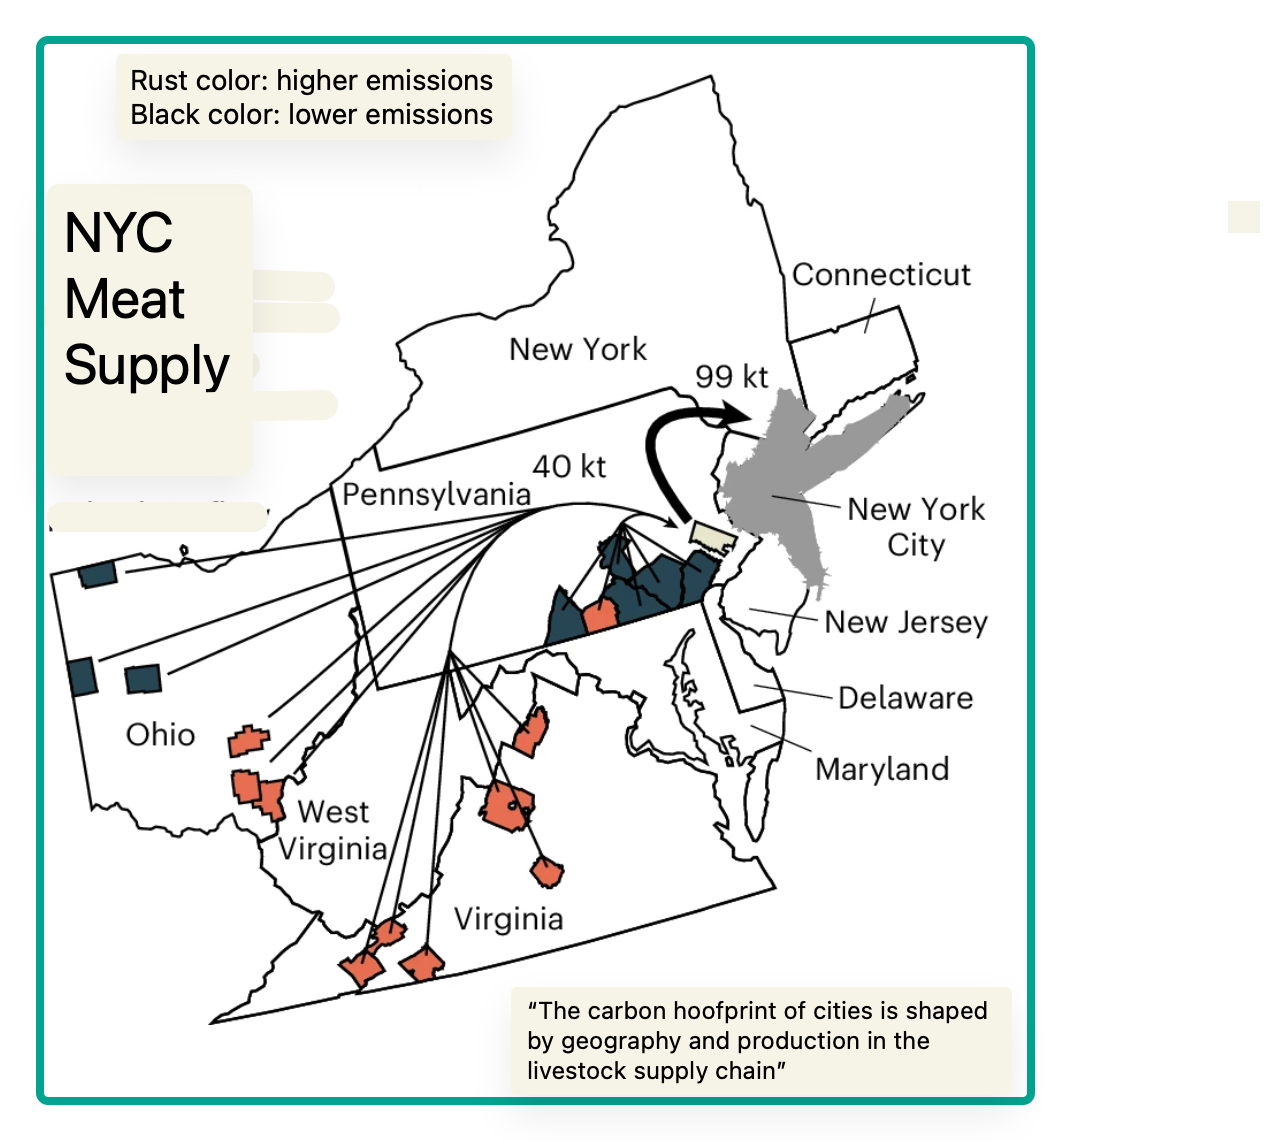
Through their emissions on the supply side, cows, pigs, sheep, and chickens create a hoofprint. However, some meat producing regions produce a larger hoofprint than others. With Texas, Oklahoma, and Missouri the highest, and the Midwest (Wisconsin and Michigan) on the low end, the difference could be threefold.
Consequently, your GHG number mostly depends on supply:
For New York City’s supply, the farms’ emissions vary:
So, what should we do?
Solutions
The paper we’ve focused on suggests 4 pathways to “hoofprint decarbonization.”
- Halve food waste
- Halve beef consumption, replace with pork and chicken
- Halve beef consumption, replace with chicken
- Skip meat for one day weekly
But a new diet has a different cost:

A Burp Tax
Perhaps, we just need a burp tax.
Starting during 2030, Denmark’s tax on emissions from cows, sheep, and pigs will be a 300 Danish kroner per ton tax (approximately $43). More than doubling by 2035, the package included a tax rebate.
Recognizing the complexity and the cost of monitoring burps, New Zealand changed its mind. With the arrival of a new government in 2024, New Zealand (5 million people/10 million cattle) abandoned its methane tax plan scheduled for 2025.
Our Bottom Line: Tradeoffs
As economists, we know that decisions always take us to opportunity cost. Defined as the next best alternative, the opportunity cost of a decision is always a tradeoff. However, to assess the environmental tradeoff, we need the numbers from studies that dig deeper into supply and demand. As in the past, it returns us to Benoit Mandelbrot and the British coastline.
The closer you look, the more you see.

My sources and more: I began with this Washington Post article after it grabbed me. The perfect complement, this paper had the detail. And from there, Our World in Data, WSJ, and past econlife posts here, here, and here had more of the story.
Please note that several of today’s sentences were in a past econlife post.

