![econlifelogotrademarkedwebsitelogo[1]](/wp-content/uploads/2024/05/econlifelogotrademarkedwebsitelogo1.png#100878)


Our Weekly Economic News Roundup: From Toilet Paper to Pollution
March 14, 2020
How (Not) to Eliminate Face Mask Shortages
March 16, 2020
We can look back more than 250 years to see when we started thinking about bulls and bears.
Legend tells us that the bears came first. During the 18th century, you could have been warned not to “…sell the bearskin before the bear is caught.” Having just sold something you did not have, a bear jobber needed to buy it, and give it to his customer. Since he “sold” the skin before he “bought” it, to make money, the price had to go down. From that time onward, the bears were associated with a declining price.
The bulls seem to have been a response to the bears. Dating as far back as the 1500s, the sport of bear and bull baiting involved the two animals. So, once bear referred to price drops, bull meant the opposite.
Fast forwarding to now, we have bear markets that start with a decline of more than 20 percent from a previous high. Meanwhile, on the upside, the bulls can point to a 20 percent rise after a slide. But primarily, we are just referring to a market with consistently rising prices.
Bull and Bear Yardsticks
While we also look at the Dow Jones Industrial Average, the S&P 500 is the official yardstick for bull and bear markets.
The Dow Jones Industrial Average
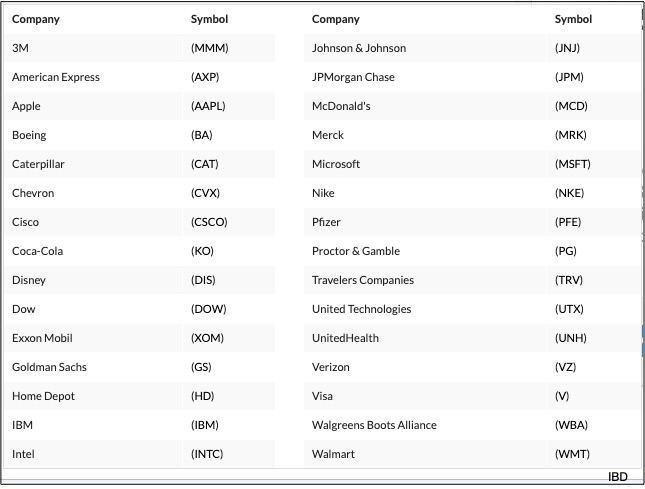
The Dow Industrial Average is composed of 30 major corporations. Because of stock splits and other fundamental price changes, you can’t just add up the stock prices and divide by 30. So they use a constantly changing divisor. There is bit more to it but you get the picture.
These are the Dow Industrials:
This was the first Dow Industrial Average:

The S&P 500
Much more recent, the first S&P 500 was published in 1957. Because it tracks 500 large corporations that are supposed to be representative of the U.S. economy, it has been used as a benchmark to signify the onset of bull and bear markets. The companies in the Index range from Alphabet (Google’s parent) to Xerox and Zoetis (animal health pharmaceuticals).
Recent Bull and Bear Markets
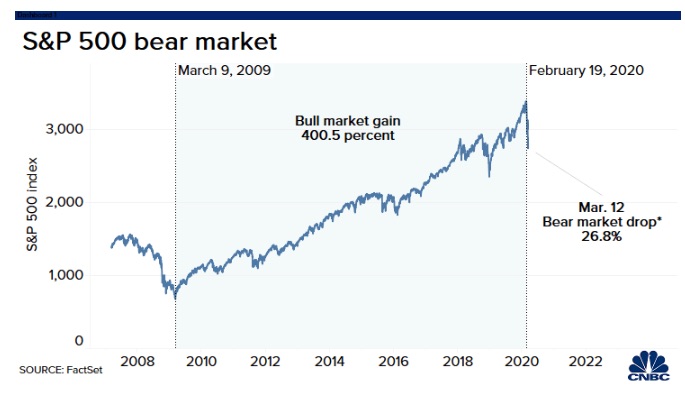
After a bull market that rose more than 400 percent and lasted 11 years, the bear has arrived. CNBC shows the decline beginning on February 19, 2020. However, that 20 percent line was crossed by the Dow on March 11 and the S&P, the next day:
 Going back to 1932, you can see that the bulls have lasted longer than the bears:

Our Bottom Line: Stock Markets
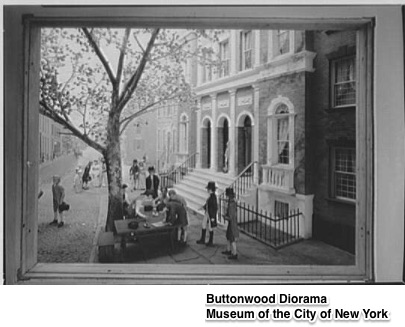
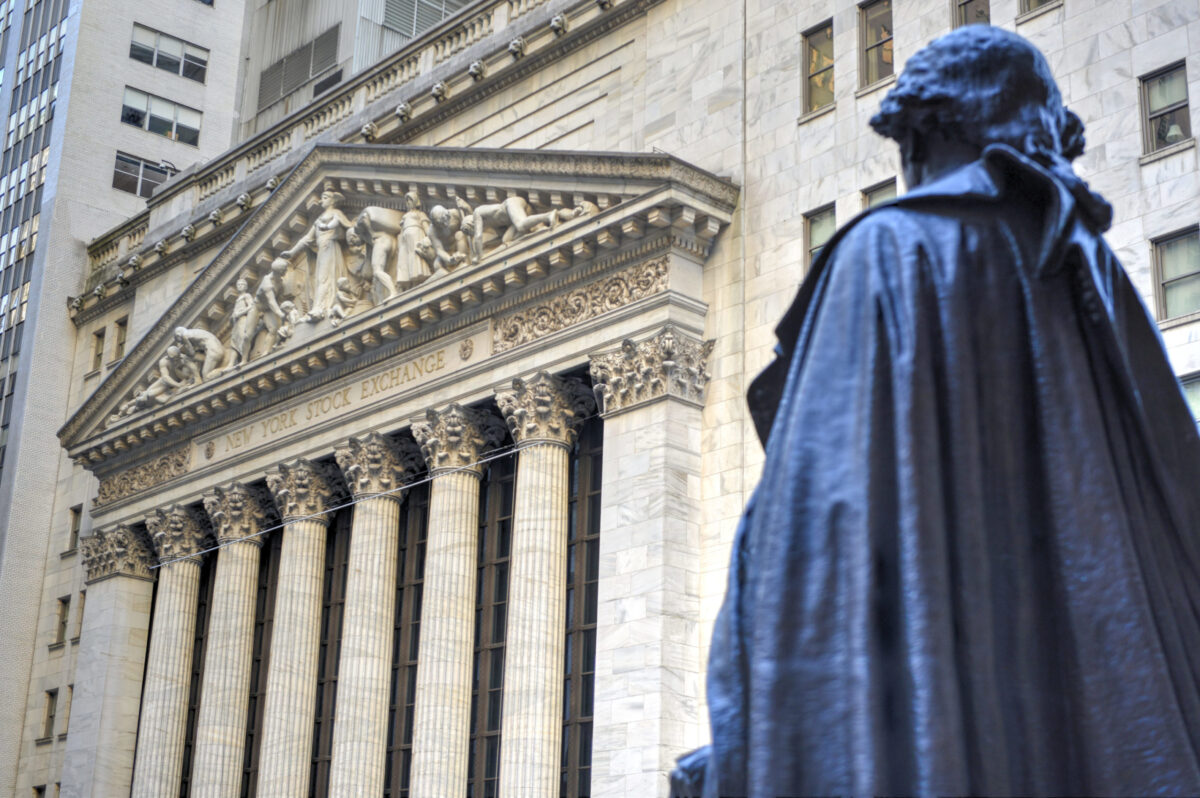
In 1792, 24 men who had been trading government bonds and bank stocks under a Wall Street buttonwood tree made a deal. Hoping for more order, integrity, and better records, they signed the Buttonwood Agreement. Their deal became the seed from which the New York Stock Exchange grew.
The buttonwood tree (below) was toppled by a storm on June 14, 1865:
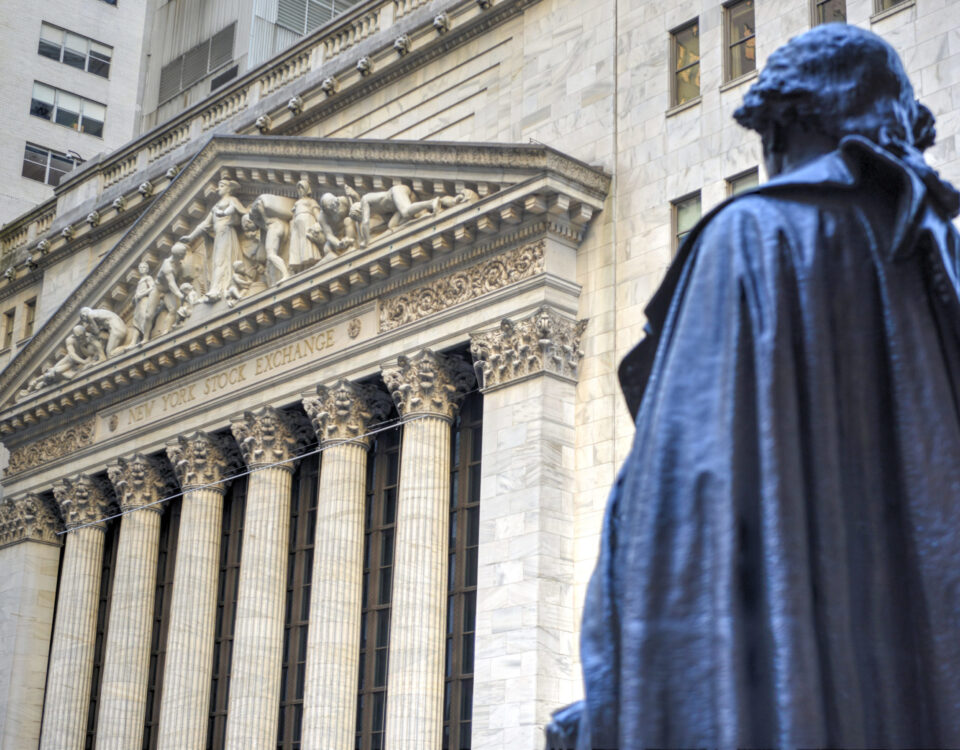
Whether looking under a buttonwood tree or at today’s stock markets, the goal is the same. We need a central marketplace that connects investors and businesses.
My sources and more: CNBC is a good starting point for more detail on market turbulence. From there, to see the recent share price for each Dow stock, IBD was ideal. As for the terms bull and bear, my own Econ 101 1/2 had the original story as well as Quartz. Please note that parts of our NYSE and Dow history were in a previous econlife post.
