Why We Will Miss the Candy We Never Loved
April 12, 2018
Weekly Economic News Roundup: From Higher Ratings to Lower Rents
April 14, 2018An economist could say that three “lows” and one “high” bring happiness:
- low inflation
- low unemployment
- low interest rates
- high growth
Taking the flip side, they also let us identify misery.
The World’s Misery
Economist Arthur Okun (1928-1980), created the first Misery Index. By adding together the inflation rate and the unemployment rate, he had a measure of economic distress. I guess it makes sense that when purchasing power dips and joblessness climbs, there are fewer smiles.
Now though other economists have taken the idea a step further. Johns Hopkins Professor Steve Hanke tells us that we should add interest rates and growth to the equation. More precisely, he totals the unemployment, inflation, and bank lending rates. Then, from that number, he subtracts the percent change in per capita GDP growth. When the first three rise, they are the “bads.” But if the last one goes up, it is a “good.” You can see that high numbers are alarming.
From a list of 98 countries, these are Dr. Hanke’s most miserable five in 2017:
The States’ Misery
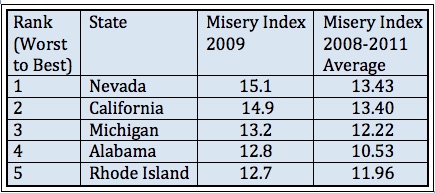
Returning to the Okun approach, we can use data from a 2016 paper to see the most miserable states during the Great Recession. To get his numbers, an SMU economist added his inflation rate formula to the unemployment rate. (The NBER dates for the recession were December 2007 to June 2009.)
From a list of the 50 states, these were the five most unhappy:
U.S. Misery
Returning to the Okun approach, for the worst U.S. numbers, we can look back to the stagflation of the early 1980s when we had a stagnant economy and inflation. Now though, combining exceedingly low inflation and unemployment, our March misery index was 6.46:
However, even with such a low index number, the U.S. is not among the 10 least miserable countries:
Our Bottom Line: Misery Index Questions
Like all statistical yardsticks, a misery index can be a handy tool. However, we should also remain aware of its defects:
- With unemployment, we are looking at the tip of the iceberg. Although we can have too low a participation rate, too many discouraged workers who left the labor force and part timers who want full time jobs, still the unemployment rate can be attractively low.
- As for the inflation rate, the index assumes that low inflation numbers are good, even when they are too low.
- And thinking of unemployment and inflation together, equal weighting could sometimes be misleading. Unemployment can generate much more misery than inflation.
So, even with the U.S. Misery Index approaching its 60 year low, we might be sadder than we think.
My sources and more: The more you look, the more misery indexes you find and the more interesting it becomes. The Hanke list and some analysis were at Cato while this paper had the U.S. states numbers. Meanwhile, there were many possibilities at Bloomberg.
Please note that several sentences from today’s post were in a previous econlife.
This post was slightly edited after publication.
![econlifelogotrademarkedwebsitelogo[1]](/wp-content/uploads/2024/05/econlifelogotrademarkedwebsitelogo1.png#100878)


2 Comments
I’m bloody miserable!!
Wow, so am I!!