![econlifelogotrademarkedwebsitelogo[1]](/wp-content/uploads/2024/05/econlifelogotrademarkedwebsitelogo1.png#100878)


How Women Could Elevate the Saudi GDP
July 11, 2017
Throwback Thursday: Looking Back at the Tiffany Brand
July 13, 2017
Just like former NYC Mayor Ed Koch used to say rather regularly “How am I doing?” it would be nice to ask how the economy was doing without waiting for a quarterly GDP report.
But we can.
Where are we going? To the Nowcast.
The Nowcast
I suspect it all started with the weather.
When nowcasting is used with the weather, it means a short-term prediction based on current conditions. The nowcast refers to the next several hours, not days.
Similar to weather men and women (weather people?), economists use algorithm-generated nowcasts to forecast the present. Their goal also is to form the big picture as they float through a sea of data.
A Nowcast Graph
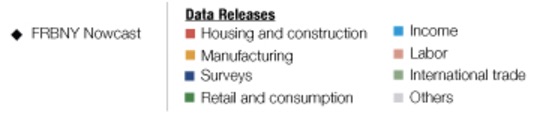
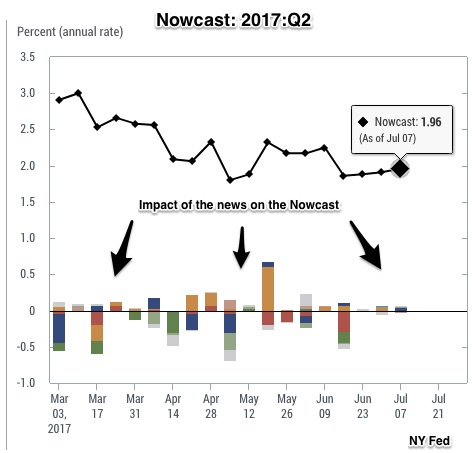
In a NY Fed Nowcast graph (below), the colorful bars represent the up or down impact of a data release. For example, a jobs creation number of 220,000 would pull the labor bar upward while 150,000 would flip it in the opposite direction. How far? The NY Fed algorithm decides.
Below, the large black “triangle” indicates that the current Nowcast is a 1.96% annualized GDP growth rate for the 2nd quarter. On March 24th, the forecast was 2.66%. You can see that all they are doing is using daily data fluctuations to create a weekly sequence of GDP forecasts:
Our Bottom Line: the GDP
The GDP has four components tracked every quarter by the BEA (Bureau of Economic Analysis):
- Consumption expenditures
- Gross Investment
- Government spending
- Exports minus imports (X-M)
Because C+I+G+(X-M) is reported quarterly (with subsequent revisions), the Nowcast comes in handy for a day-to-day economic pulse rate.
My sources and more: I have always enjoyed the NY Fed’s Liberty Street blog because it is more lively than most other Fed communication. Here and here they describe their Nowcast. Finally, for a different nowcast algorithm, you might want to look at the Atlanta Fed’s GDPNow.

