Why There’s More to the Workweek Than 40 Hours
October 20, 2026
In the past, we’ve seen that men’s underwear and shark attacks can be economic indicators. Now, we can add pizza to our list.
Pizza Economics
Supply
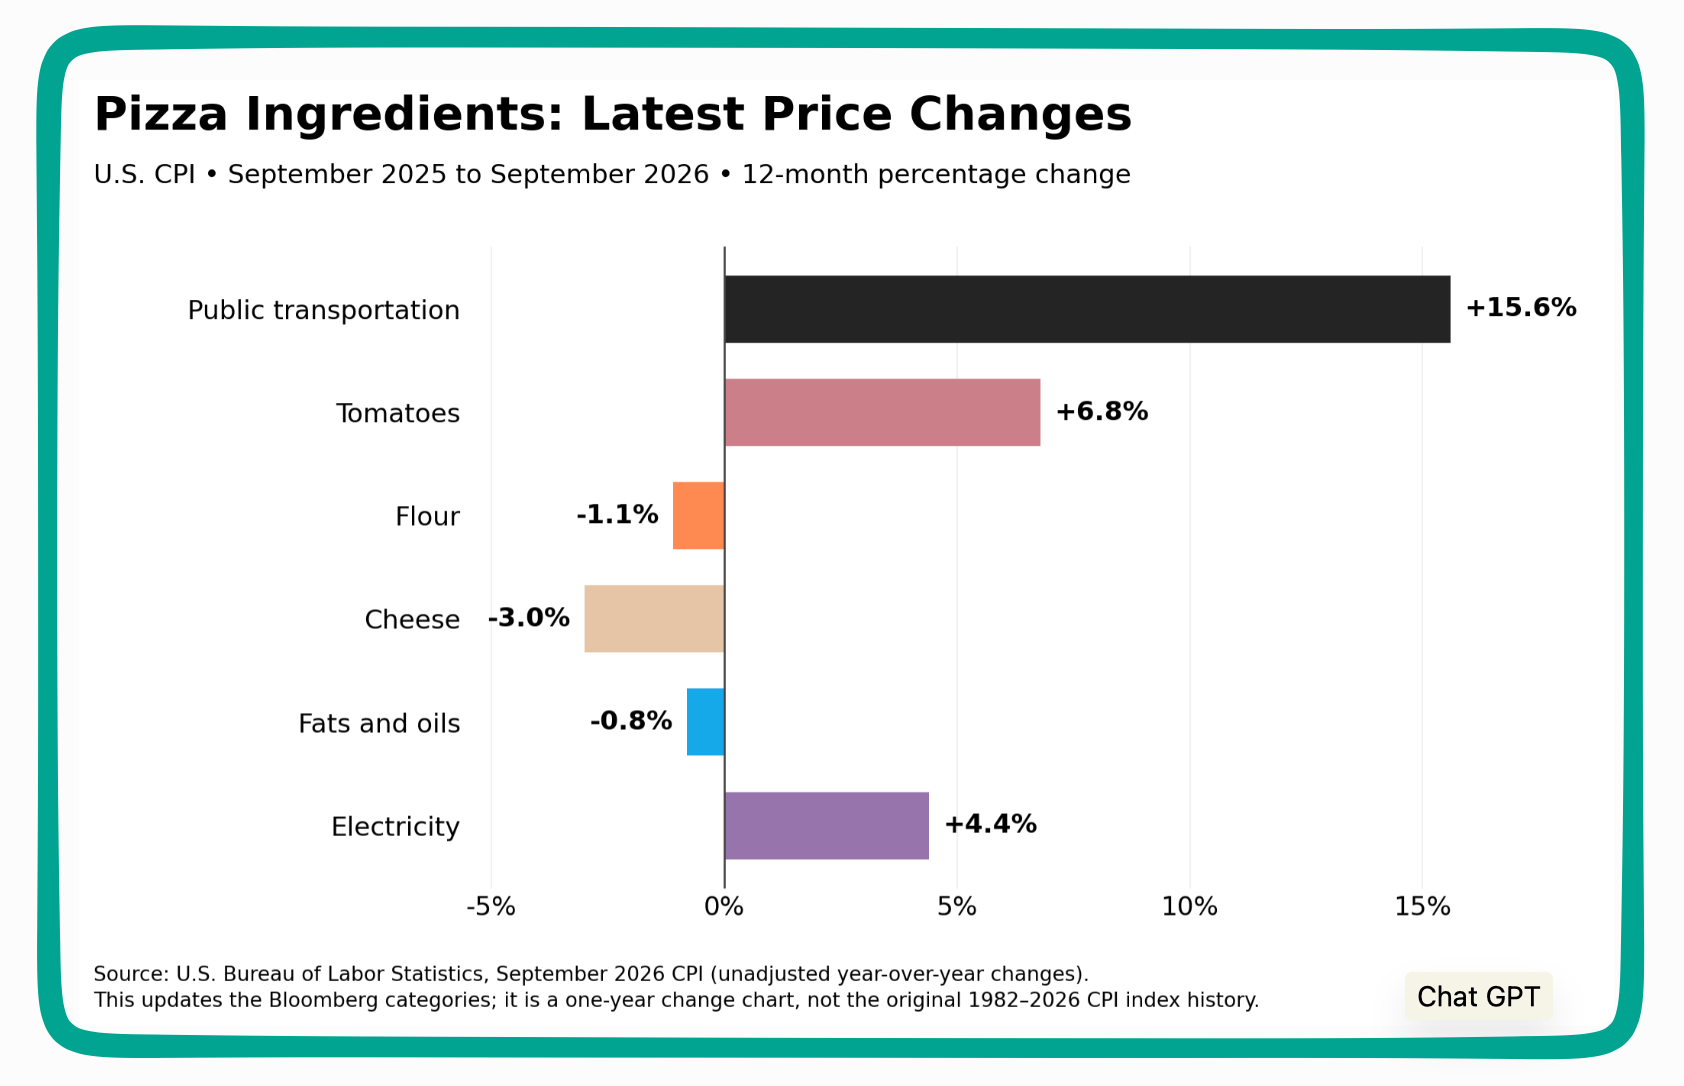
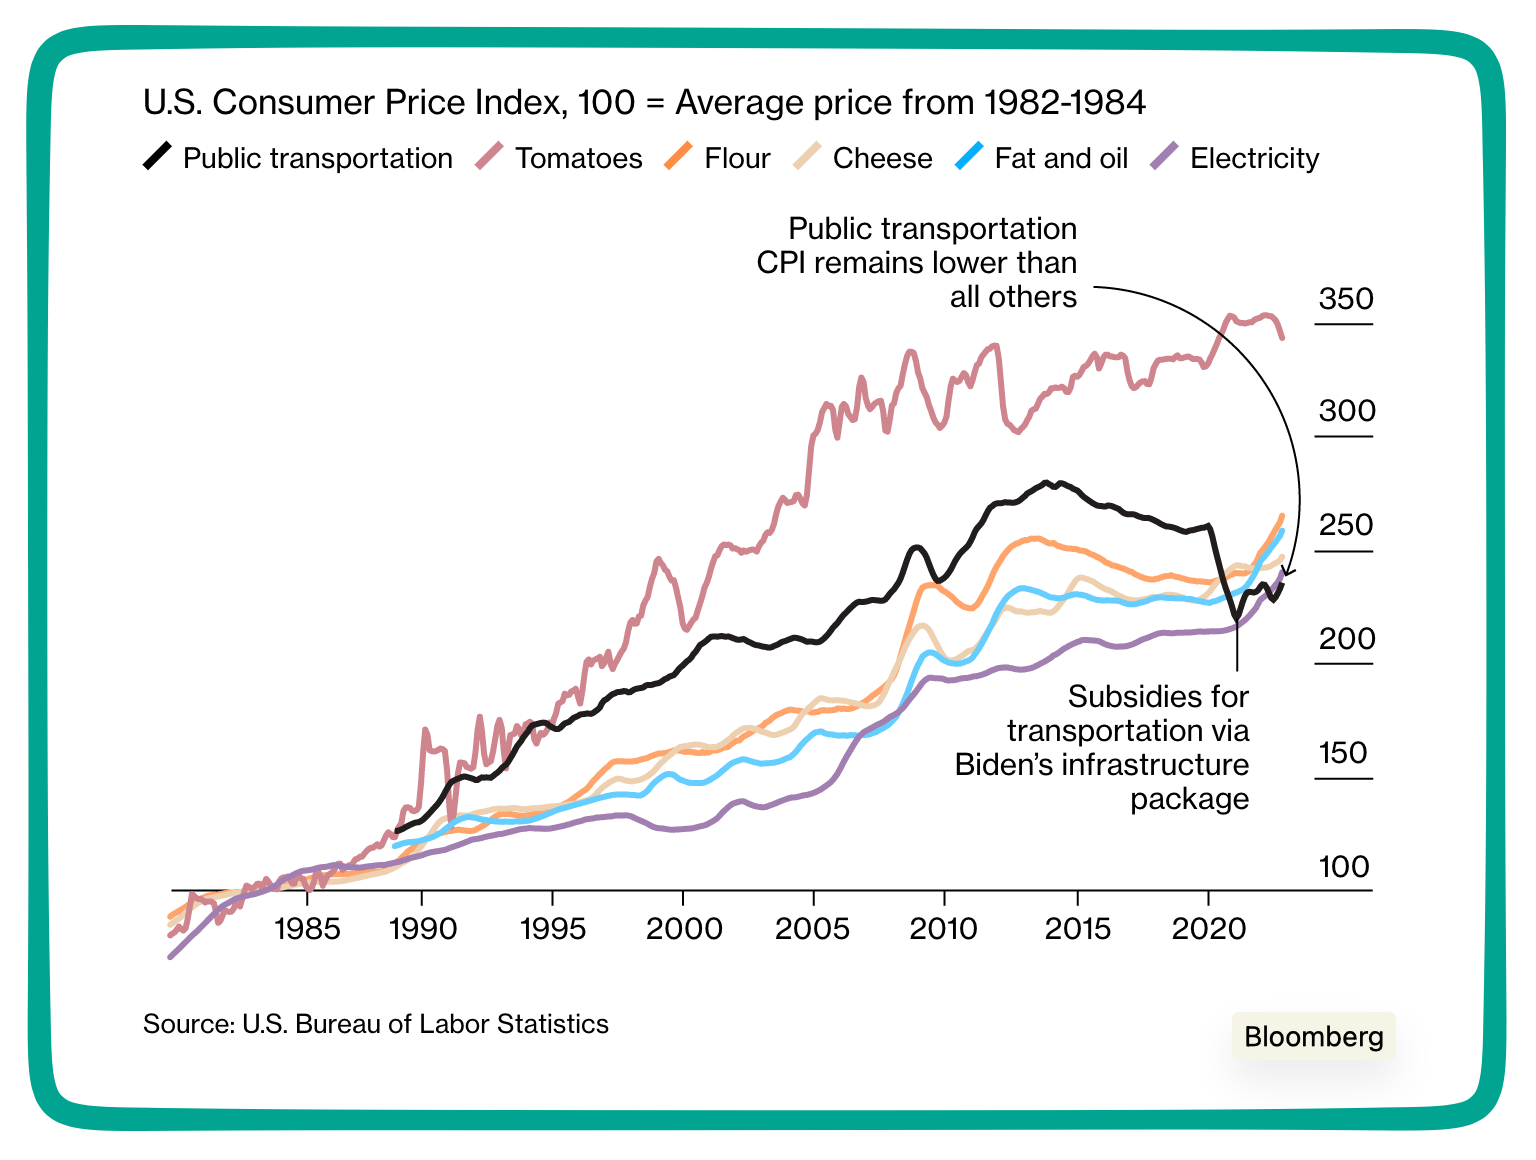
On the supply side, pizza takes us to the impact of the Iran War and tariffs. Reflected by public transportation and electricity, during the last year, energy especially became more expensive. Then, as we explained, trade policies, including tariffs, affected tomatoes. However, flour, cheese, and fats and oils prices slid slightly:
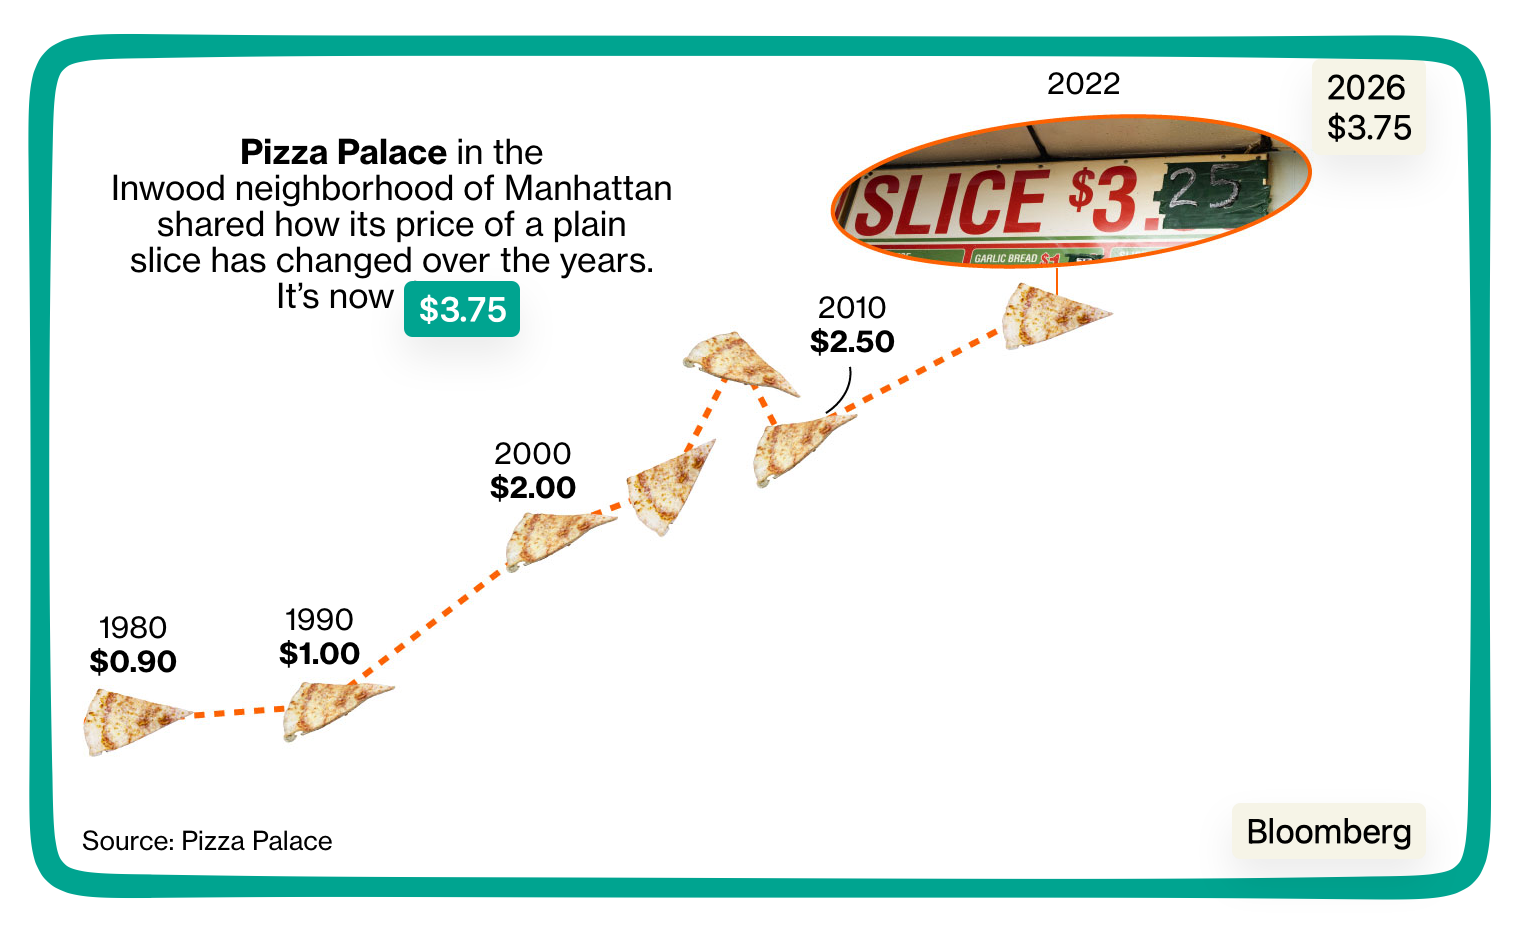
As a result, pizza establishments, like the Pizza Palace in Queens, NY, have charged us more (I added $3.75 to the original Bloomberg graphic from 2022):
Demand
On the demand side of pizza markets, we have the traditional response to higher prices. Demonstrating the law of demand, lower income pizza eaters buy less. Then also, a determinant of demand kicks in as pizza eaters replace their made-to-order pizza purchase with a frozen pie.
But we should also note that dates matter when considering price hikes. If we had begun in 1982 (from a 2022 article), the increases for all of our ingredients would have followed a steep incline:
Our Bottom Line: The “K” Economy
It all adds up to the “K” economy.
The upward sloping line of the “K” can represent the more affluent earners. In the top 10%, as one-half of all spending, they can afford $30 pizzas. By contrast, the K’s second segment, pointing downward, accurately shows the plight of families struggling with the impact of 3.7% inflation and eye-popping diesel and gasoline prices. Then, when they do buy pizzas, the less affluent cohort saves some money with take-out rather than paying a delivery fee. However, even more frequently, the data indicate that they buy frozen pizza.
Remembering New York’s Pizza Principle, the slice price never exceeded the MTA subway fare. Now, with the MTA fare at $3.00 and an average slice price close to $4.00, it does.
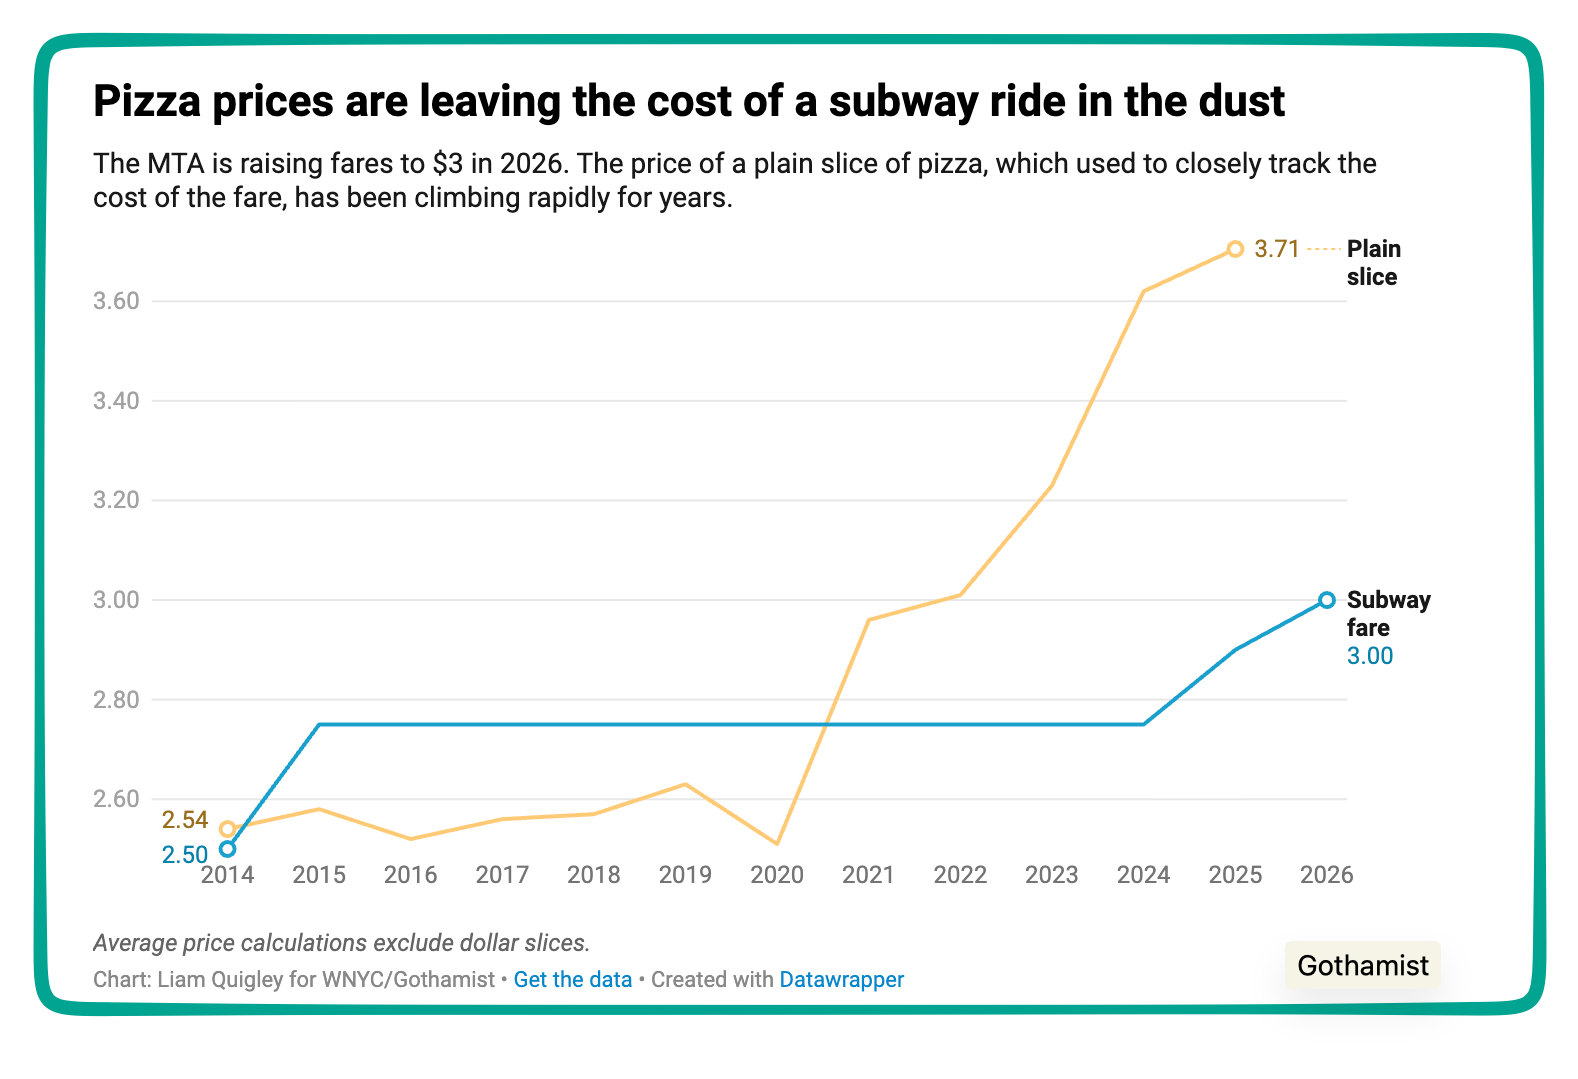
So, what does pizza tell us? Combining a slew of economic principles, it transforms dry supply and demand statistics into a tasty slice of the economy.
My sources and more: Thanks to Bloomberg for inspiring today’s post with two (gated) articles, here and here, that were ideal springboards.