![econlifelogotrademarkedwebsitelogo[1]](/wp-content/uploads/2024/05/econlifelogotrademarkedwebsitelogo1.png#100878)


When and Where Do We Tip the Most?
December 14, 2025
Where Grid Stress Creates Corporate Stress
December 16, 2025
During 2023, we spent a 56% slice of our food budget on dining out–13% more than 2000.
Let’s take a look.
Food Spending
Away From Home
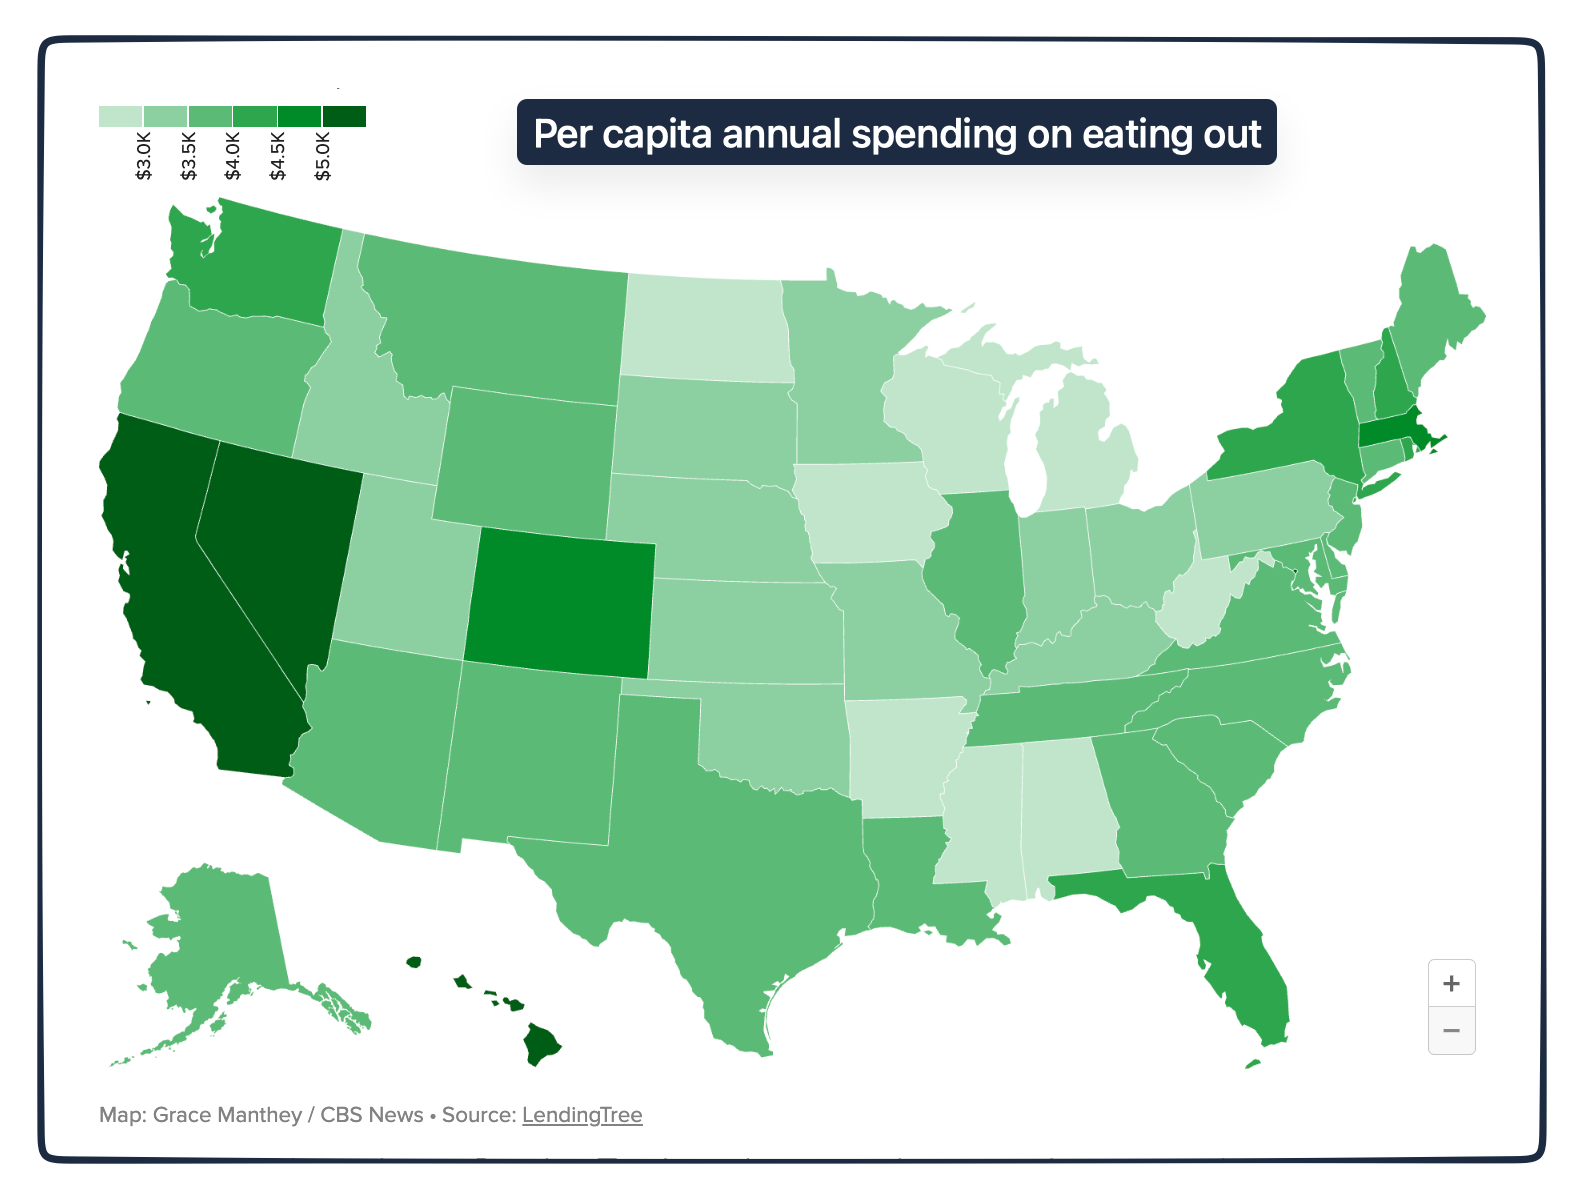
According to data from 2023, Washington D.C. tops the nation for dining out. Exceeding $10,000 per person annually, Washinton D.C.’s residents spend far more on food away from home than the rest of us. In second place, Nevada was at $6,752 and then California, $5,072:
At Home
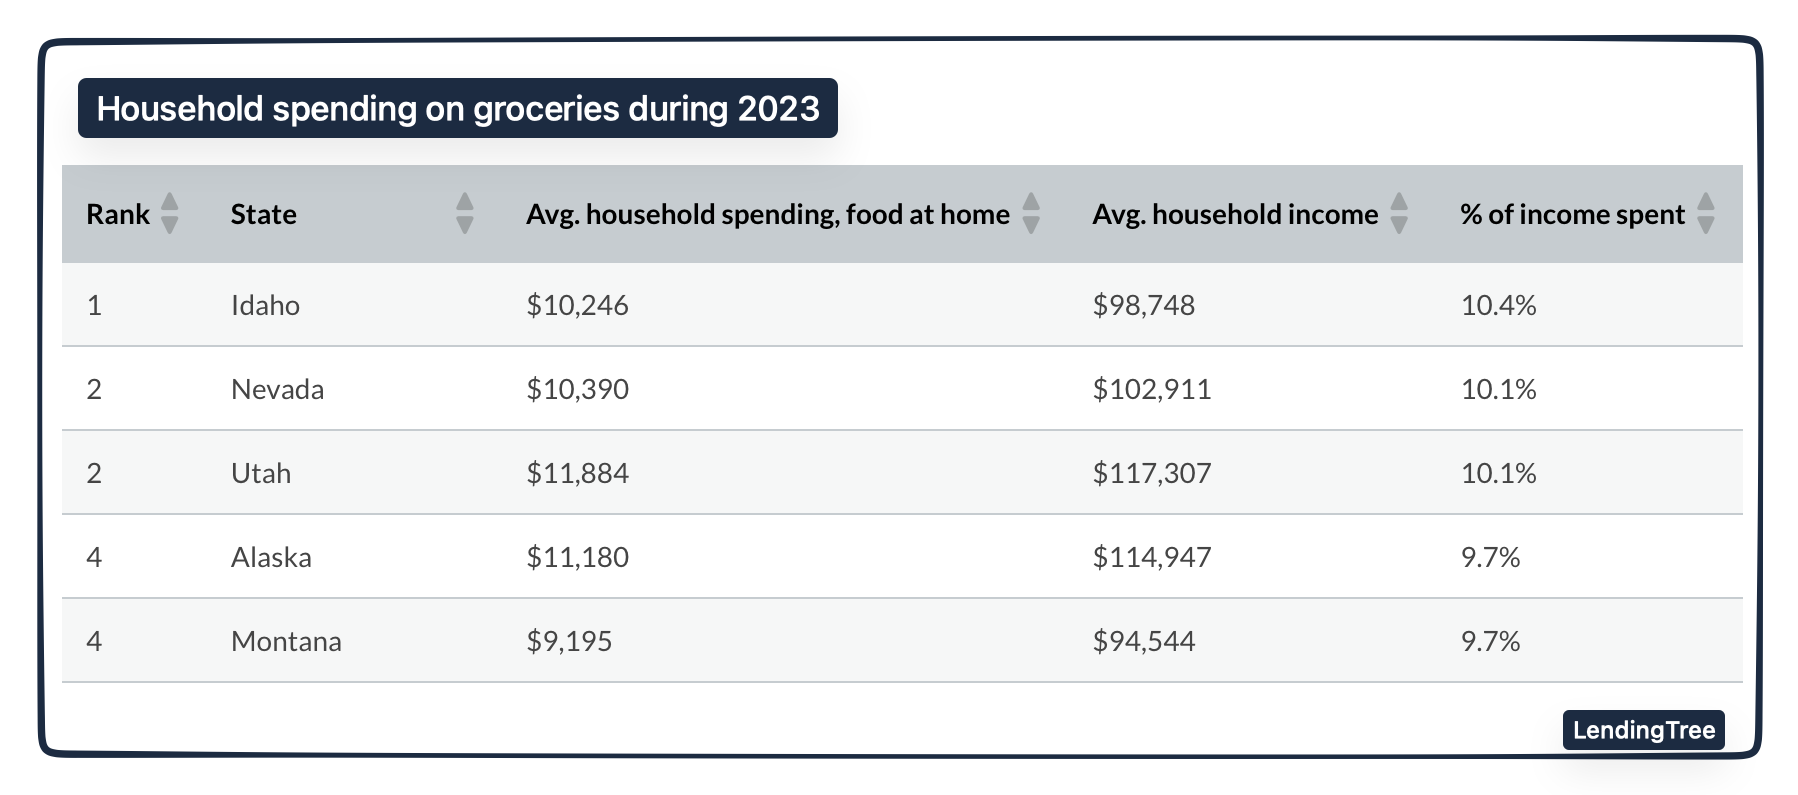
The states with households that spend the largest proportion of their income on groceries tend to be Western states with sparser populations. Topping $11,000, Utah and Alaska spent the most.
These were the top five:
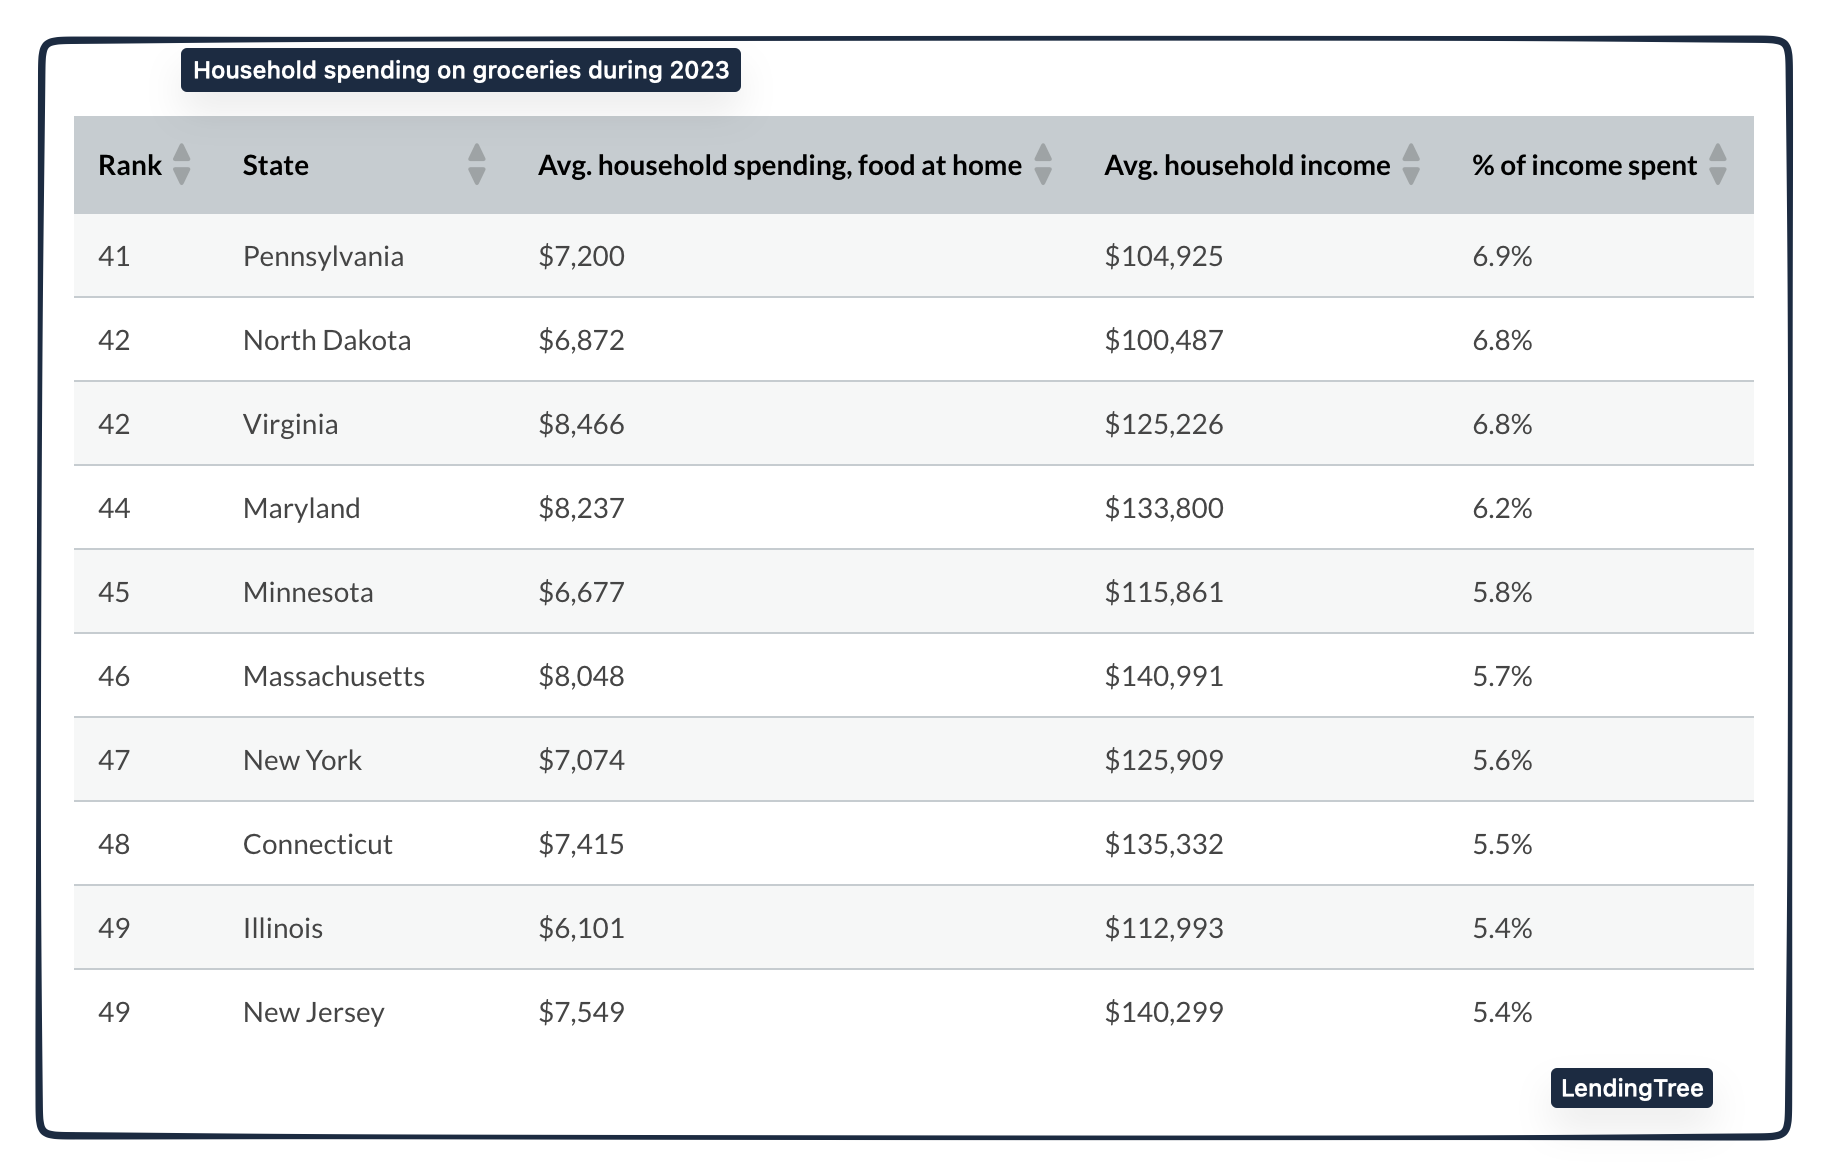
Meanwhile, the bottom five spenders tilted toward more affluent eastern states:
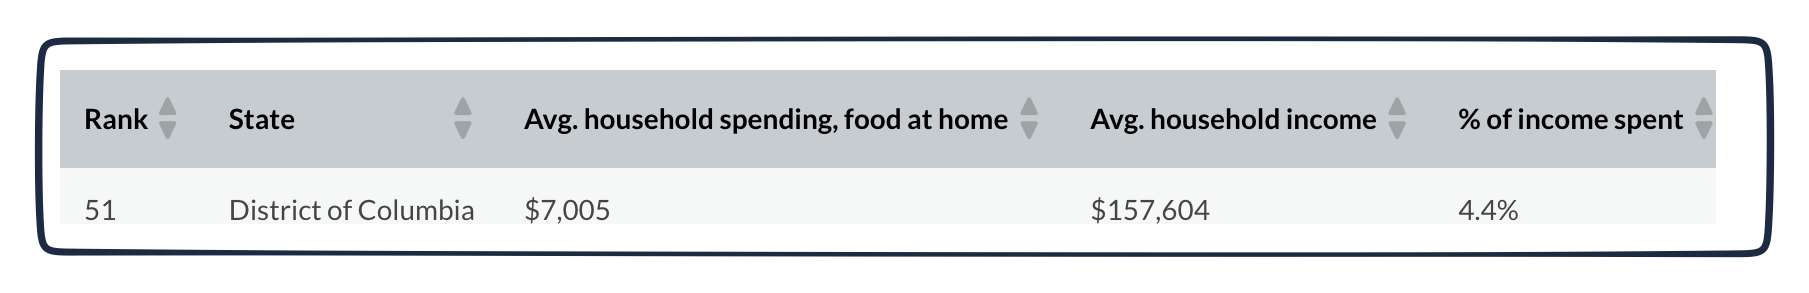
As for Washington D.C, I guess they were dining out?
Our Bottom Line: Consumption Expenditures
Reflecting our yardstick of the dollar value of the goods and services a nation annually produces, the GDP has four components. At 70% (or so) in the U.S., its largest slice is the consumption expenditures that you and I spend. Next, gross investment is mainly a business category except for its residential section. Then, government spending is the third big category. And finally, net exports–exports minus imports–the fourth component, is typically negative.
Predictably, as an affluent nation, food spending represents a relatively small slice of the GDP. You can see that globally also the U.S. is typical:
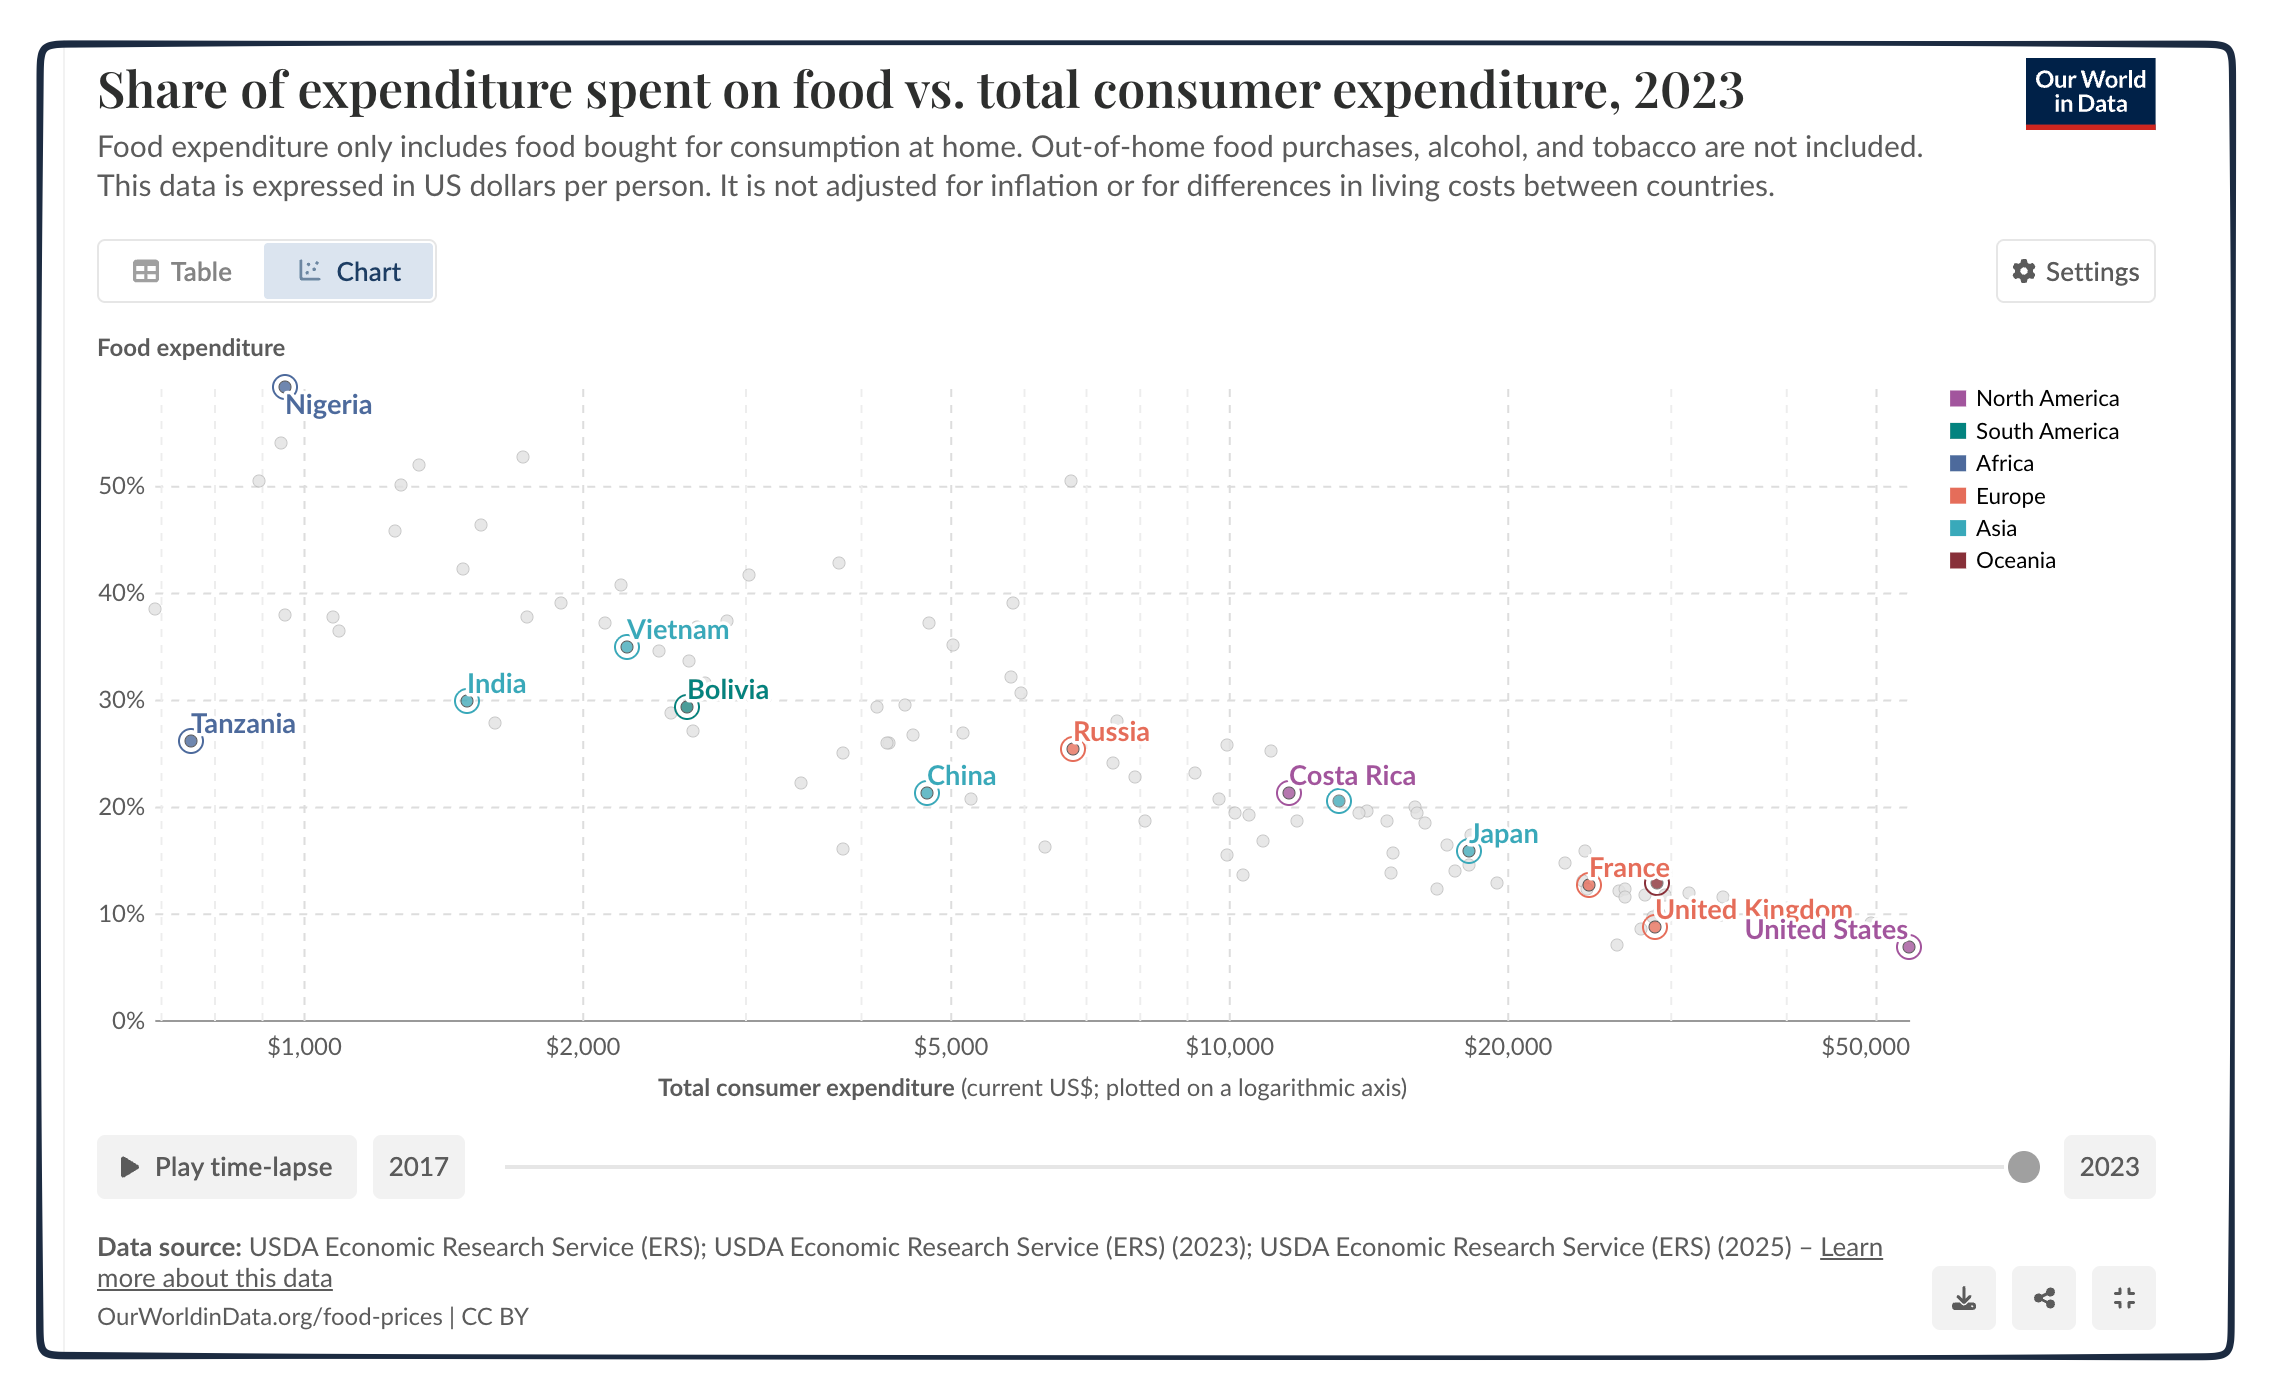
It all takes us to Engel’s Law. While richer households spend more on food, the amount is a smaller proportion of their income:
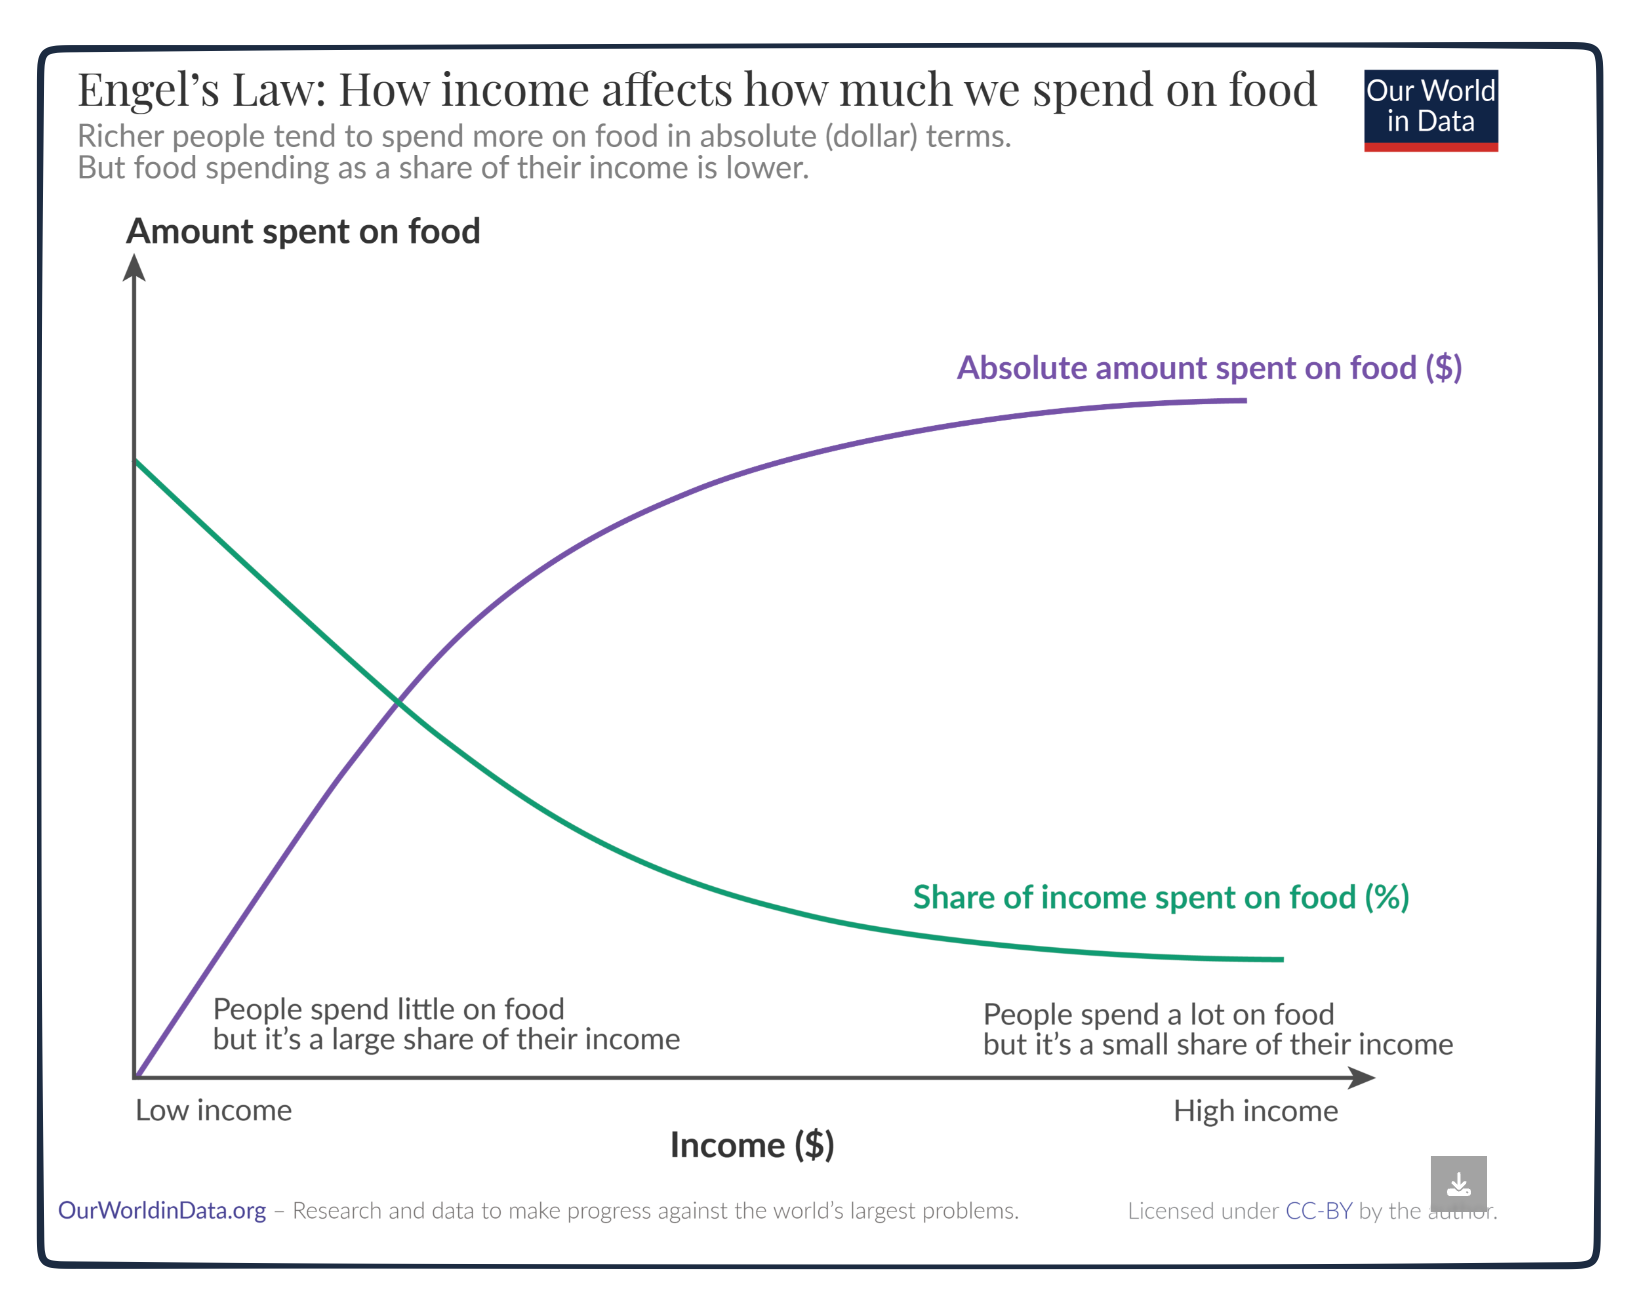
My sources and more: Our start for today was this LendingTree study But they had so many others that it was tough to stop. But do also look at this one on grocery spending. Then, Our World In Data had more on Engel’s Law.


