![econlifelogotrademarkedwebsitelogo[1]](/wp-content/uploads/2024/05/econlifelogotrademarkedwebsitelogo1.png#100878)

Why a Tariff Could Change AriZona Iced Tea
August 12, 2025
What a Free Good Really Costs Us
August 14, 2025
Yesterday, the BLS reported that the CPI was up by 2.7 percent during the past 12 months, July to July. Called disinflation, at 2.7 percent, the rate of inflation was less than the 2.9 percent rate for the same time period in the previous year.
However, an inflation breakdown shows us what really happened.
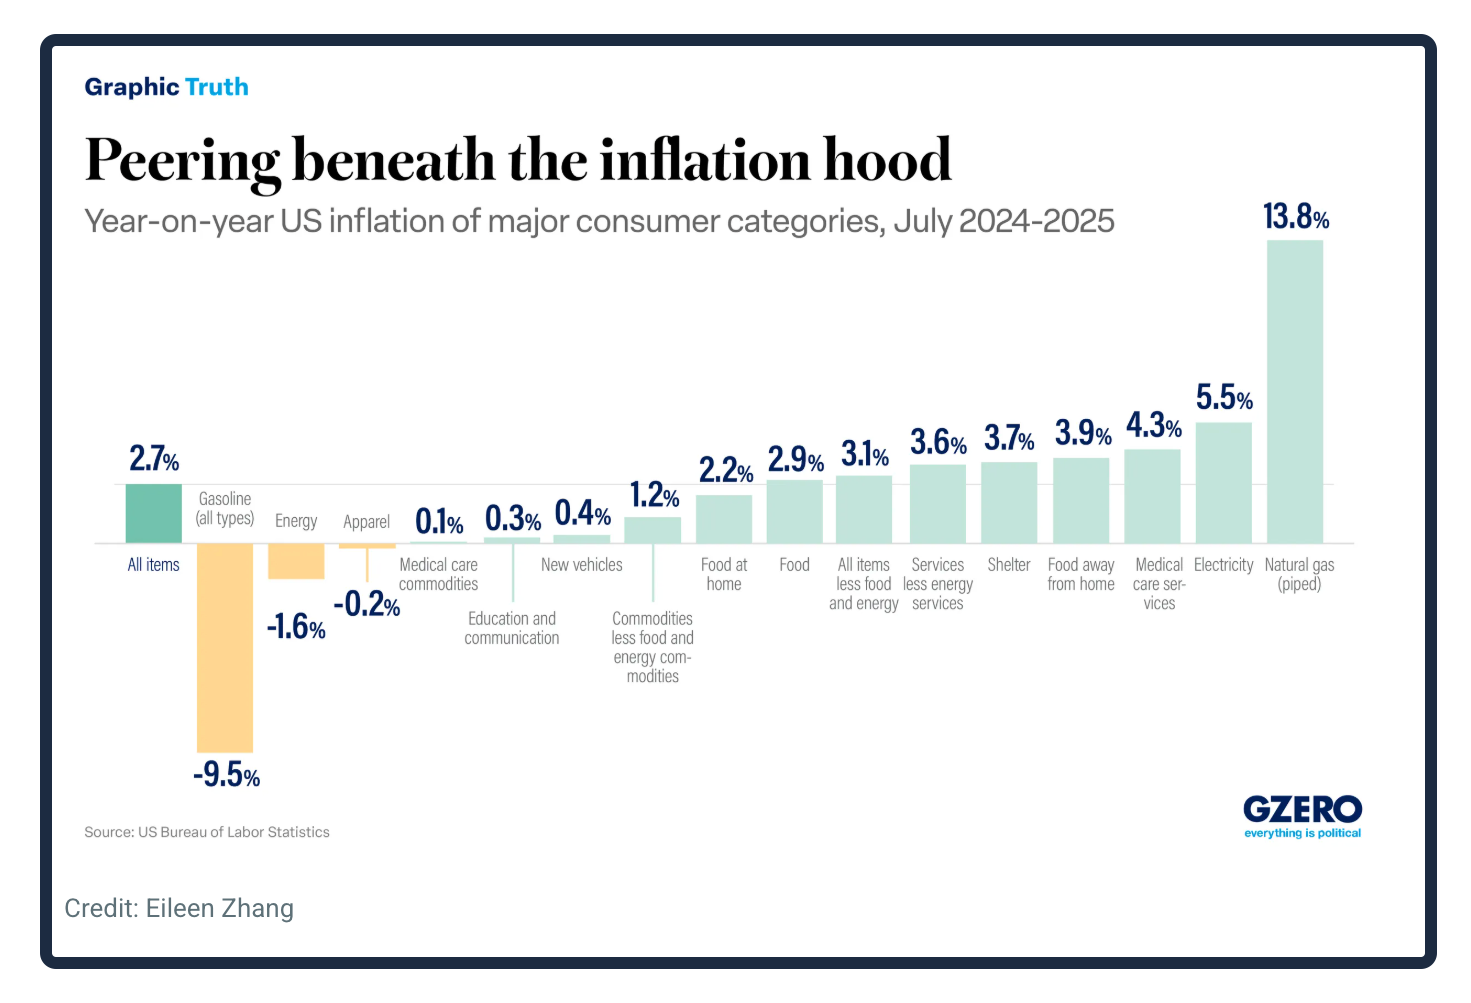
Inflation Breakdown
Looking more closely, you can see that piped natural gas, electricity, and medical services nudged the rate higher. However, during July, prices slipped downward for electricity and natural gas. So, as much as electricity and piped natural gas propelled the inflation rate upward during the past 12 months, for this month, they helped to bring it down:
More precisely though, all items were not up as much, and some prices even declined. For the food at home component, meat, poultry, fish, and eggs had increases at more than an eye popping 5 percent: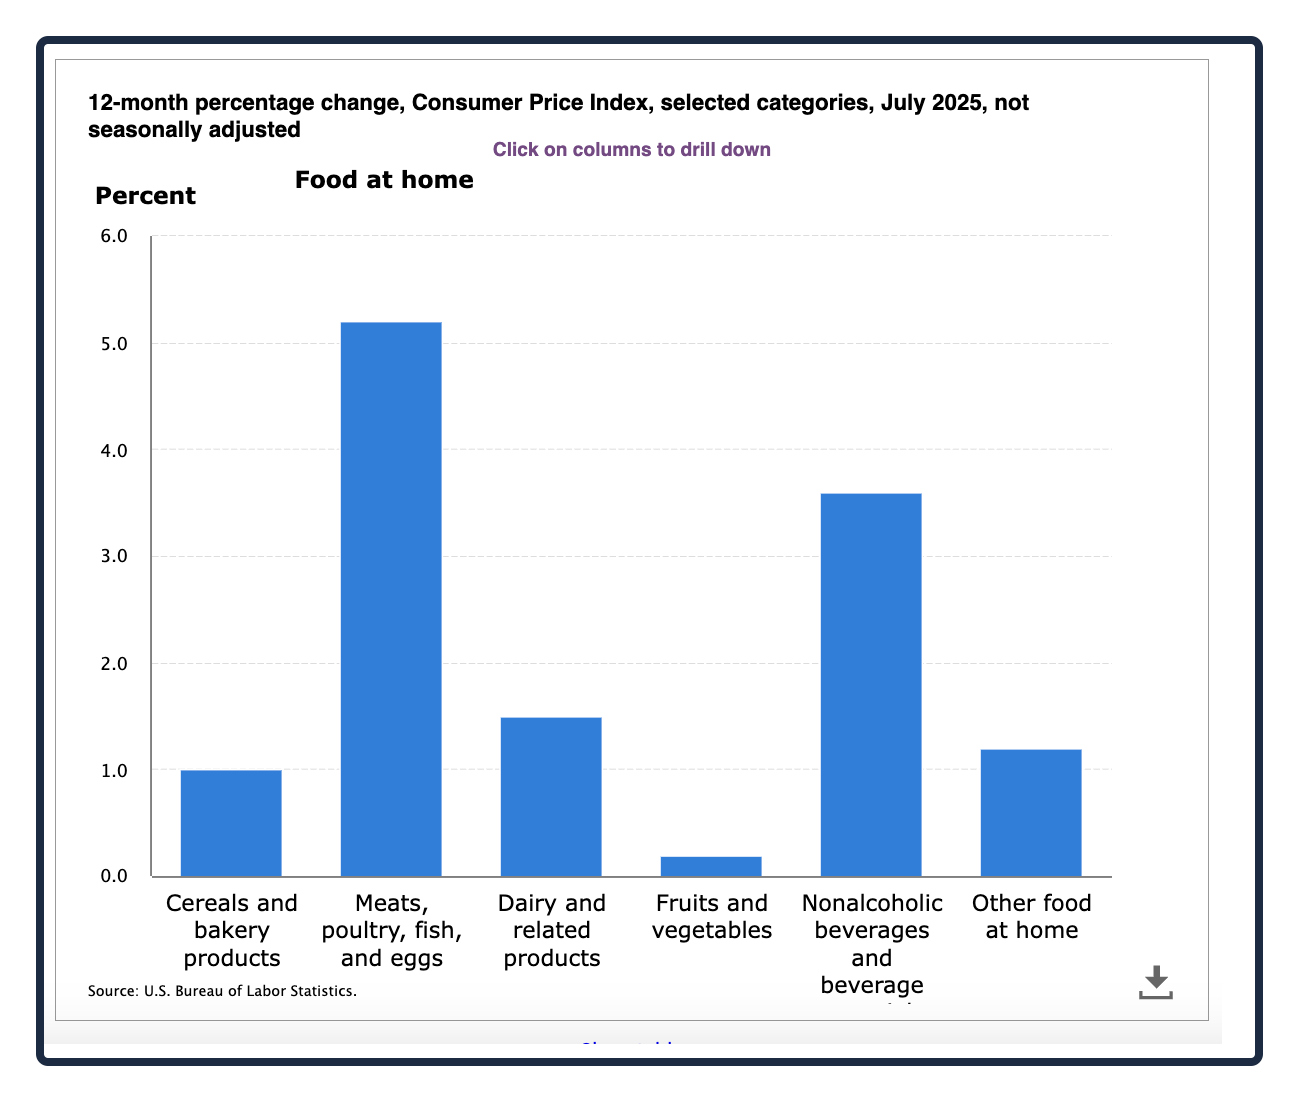
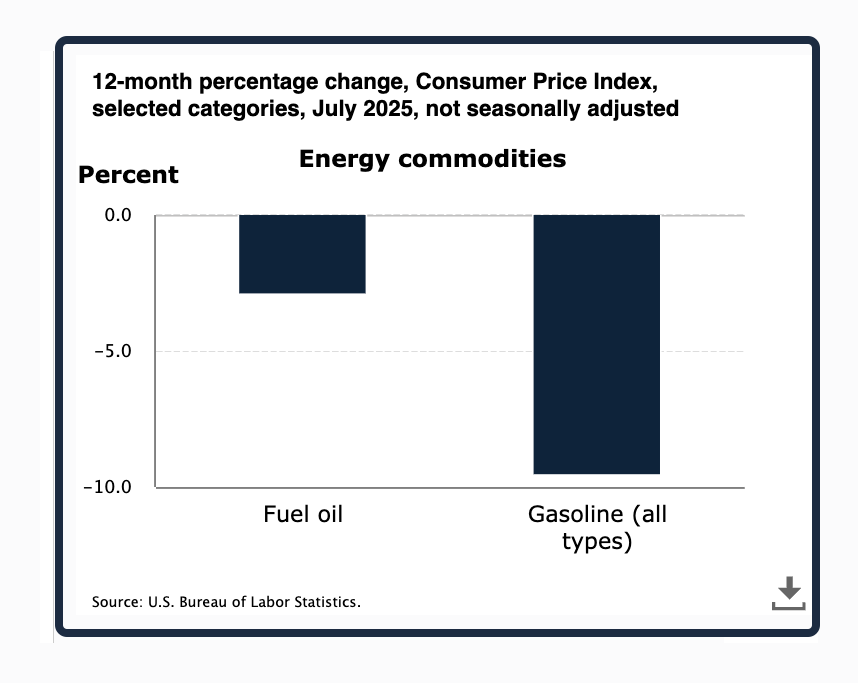
By contrast, energy was the decliner:
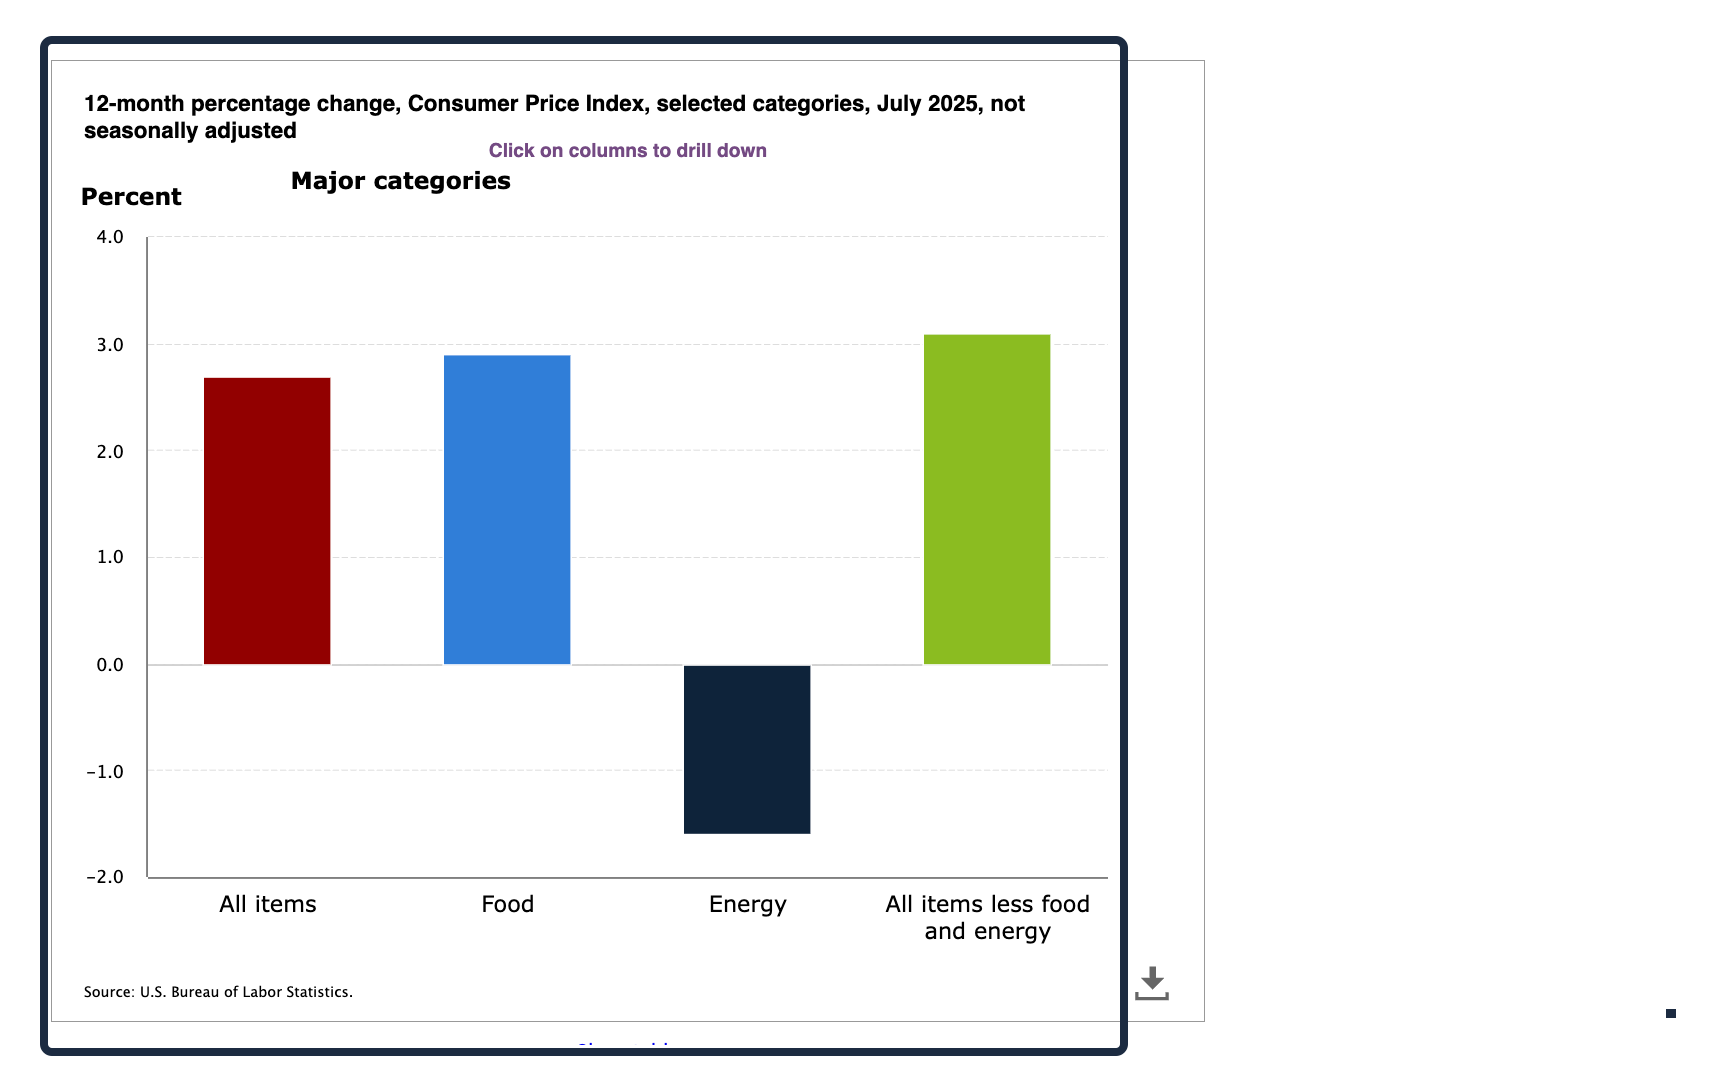
Cheaper gasoline and fuel oil helped to push energy prices downward:
Our Bottom Line: Spending Power
Between 2000 and 2024, as an average, we needed less work time to buy the CPI goods and services basket. More precisely, prices were up 87.3 percent while average hourly wages rose by 123.3 percent. Translated into a time metric, we moved from one CPI basket in 2000 to 1.192 in 2024.
However, it truly all comes down to our spending power. Yes, prices can increase but if our work time decreases, then we are better off. According to economics Professor Gale L. Pooley at Utah Tech University, we should look at an “abundance multiplier.” Defined as “a value that indicates how many units of an item you could buy in 2024 for the amount of work time it took to buy one unit in 2000,” the abundance multiplier can make inflation data more meaningful. Looking at the numbers, we should know that above one reflects increasing “abundance” while below one says there is less:
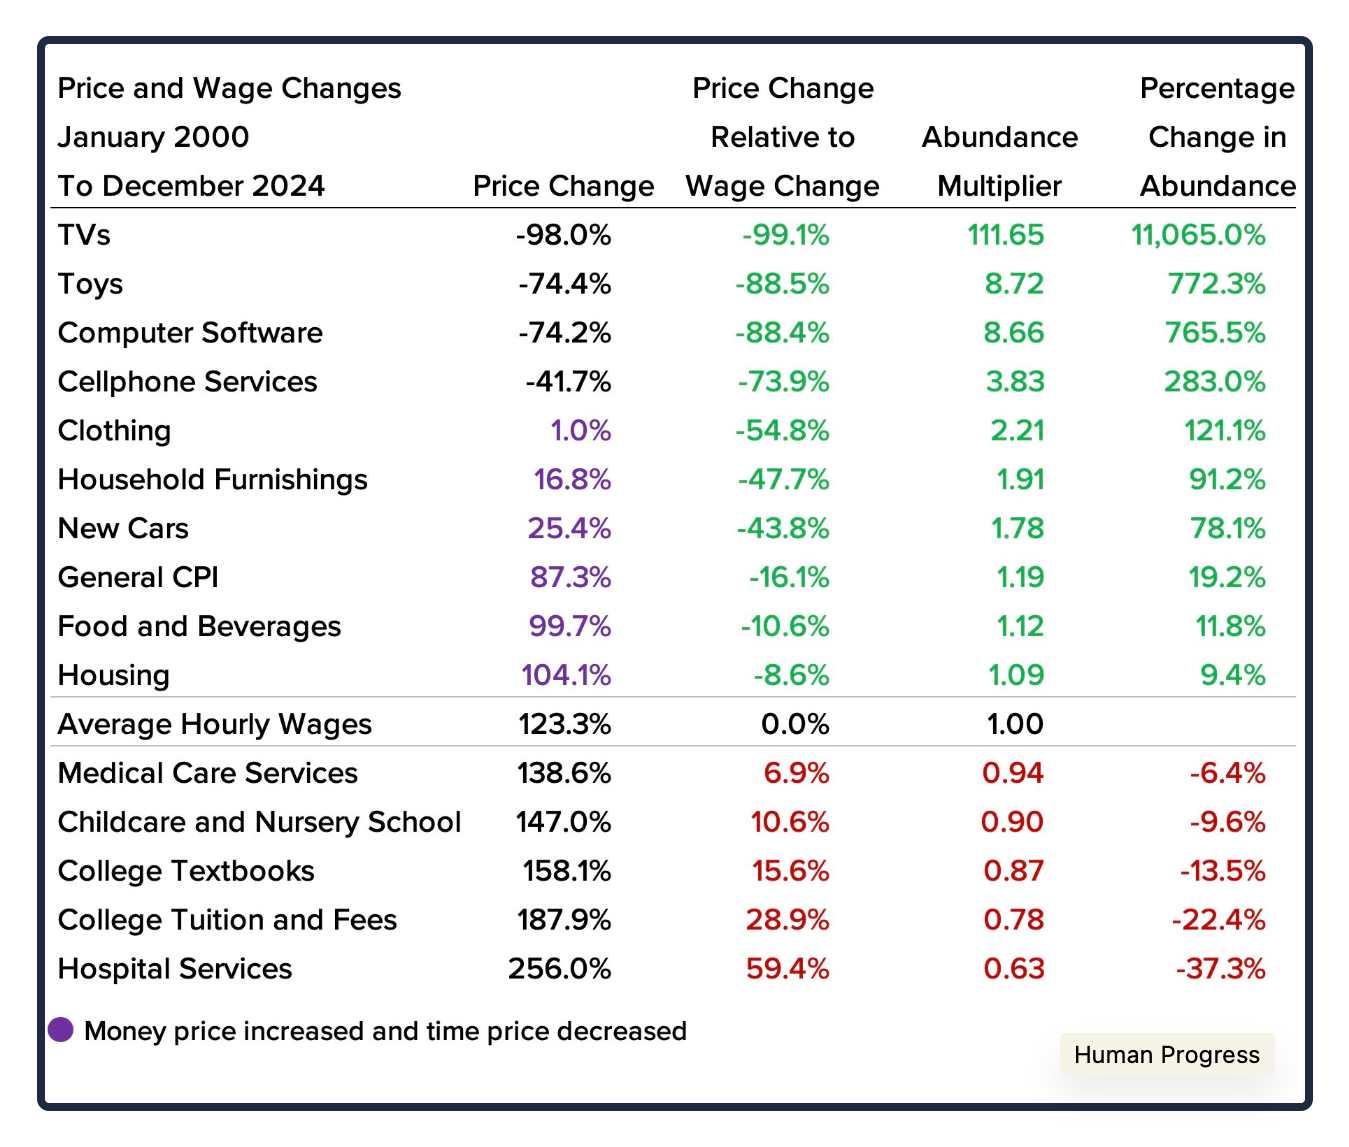
We can ask how the Trump tariffs will affect the abundance ratings for “tradable goods” like TVs, Toys, and furnishings.
Thanks to GZero for inspiring today’s post. (I do recommend their free email subscription.) Next, it made sense to go to the BLS, here, and also their Beyond the Numbers. But to understand the impact of inflation on a country, this BBC podcast about Bolivia is ideal. And finally, the Human Progress blog had our spending power explanation.
