![econlifelogotrademarkedwebsitelogo[1]](/wp-content/uploads/2024/05/econlifelogotrademarkedwebsitelogo1.png#100878)


How a Better Peanut Was About More Than An M&M
August 4, 2025
How Southwest Became Normal
August 6, 2025
With President Trump questioning the statistics coming from the Bureau of Labor Statistics (BLS), we should take a look.
BLS History
In 1884, responding to the need for information about the labor force. the Congress created the Bureau of Labor. Or as the legislation explained, they created the “means of promoting their material, social, intellectual, and moral prosperity for working people.” Because President Chester Arthur, a Republican, consulted with President-elect Grover Cleveland, a Democrat, to be sure they both agreed on Carroll D. Wright as the first Commissioner of Labor, they initiated a non-partisan tradition.
Within four years, the (original) BLS had produced the first consumer expenditures survey (perhaps a cousin of the CPI). After that, they published an index of wholesale prices and, in 1915, the first Employment Report.
Perfectly expressed by Tyler Cowen at Marginal Revolution, through it all, they have remained non-partisan.
“No, they do not sit around changing the numbers to serve the interests of Democratic presidents, or to harm Republican ones. The system has too many different steps, too many checks and balances, and too many people who do not want to do the wrong thing. In a sense, you could say that the BLS is too bureaucratic to do that. They are better thought of as an agency which maximizes process, and the successful execution of process, success being defined in heavily process-intensive terms.”
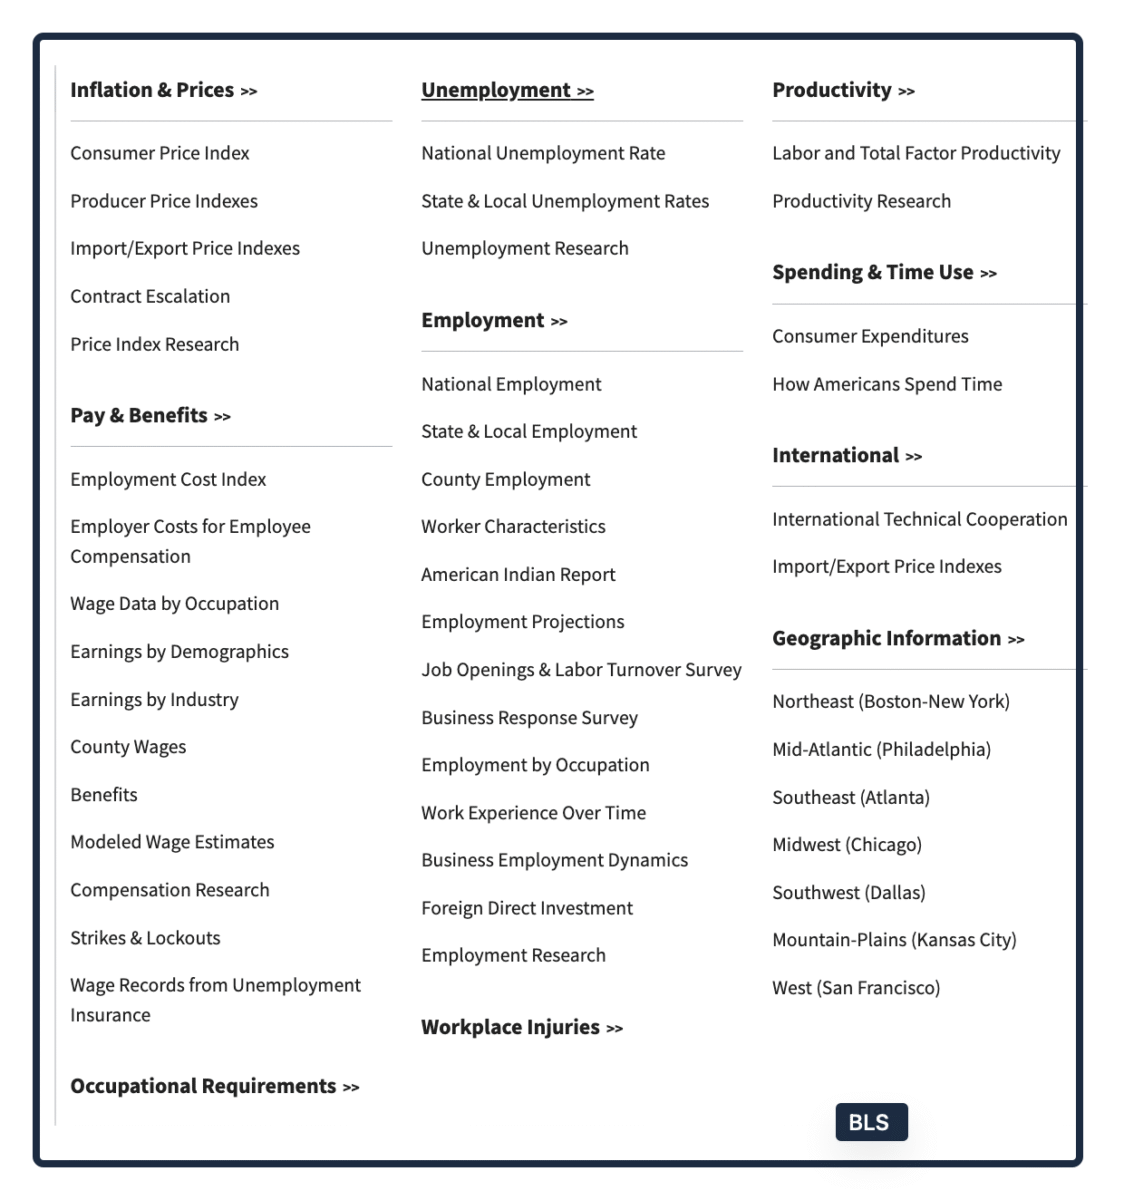
Before focusing on the Employment Report, we should note the expanse of the BLS’s information:
Calculating the Employment Statistics
The Fraction
We can start with a fraction.
By dividing the number of people in the labor force who are unemployed by the number of people in the labor force, we calculate the unemployment rate. For example, assume you have a labor force of 100 and 5 people in that labor force who are unemployed. Then, 5 divided by 100 = 5% unemployment. We should ask, though, what if immigrants leave the labor force? Then, our denominator decreases and the fraction gets larger. We get a higher unemployment rate.
The Statistics
Mid-month, the BLS collects the statistics for job creation and joblessness. In addition, the data in those reports are then seasonally adjusted to avoid, for example, a potentially misleading jobs number during the Christmas holidays.
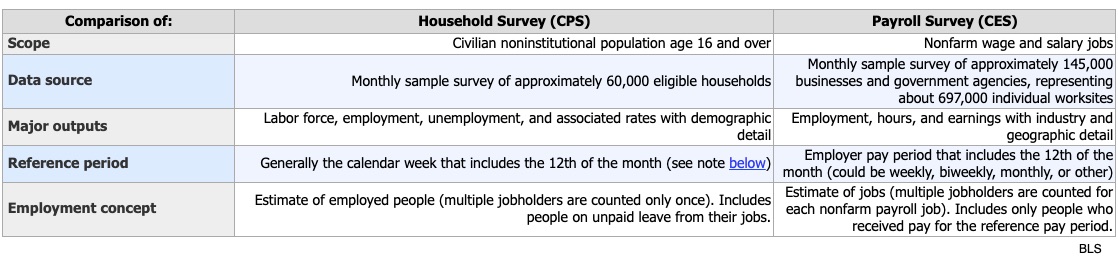
1) The unemployment rate is based on the household survey (technically known as CPS, Current Population Survey), a canvas of 60,000 households. The sample, based on home visits by Census Bureau workers, comes from the entire civilian non-institutional population aged 16 and over and even includes unpaid household workers.
2) The job creation numbers come from the establishments survey (technically known as Current Employment Statistics survey), collected from a pool of 12 million business and government establishments. Their sample, collected from submitted data, looks at nonfarm wage and salary jobs. Since just 68% of the surveyed establishents hand in their replies during the first month, the BLS accepts delayed responses. By the third month, they are closer to 100% in their revisions.
Below, you can see how the BLS describes the Household and Payroll Surveys:
Our Bottom Line: Selecting Statistics
As economists, we know that statistics can be debatable.
According to some scientists, all the ants in the world weigh as much as all the people. But we have to agree on the number of ants and their average weight. While the accepted number of ants used to be 10 quadrillion (10,000 trillion), now some say it’s 20 quadrillion. And, they might have excluded the arboreal ants that would have tipped the scales upward. As a result, depending on your numbers, you could conclude that ants’ weight equals humans or people weigh more.
Measuring Mount Everest, looking at the bottom and the top, we can have a similar debate. To begin, you need to know where sea level starts. When Nepal used the Bay of Bengal, it wound up with the summit at 29,028 feet while China chose the Yellow Sea and got 29,017. Then, for the position of the peak you have to decide whether to include the snow cover.
So yes, whatever the topic, unknowingly and intentionally, we select the data that shape our opinions.
Returning to where we began, we know we can always question data and know we can do it better. However, for its data selection and collection, the BLS has been pretty pristine.
My sources and more: Finding a slew of BLS histories, I wound up here and here, and here for their timeline. Then, leaping to the present, we went to Marginal Revolution and the Odd Lots podcast interview of Wlliam Beach, a past commissioner.


