![econlifelogotrademarkedwebsitelogo[1]](/wp-content/uploads/2024/05/econlifelogotrademarkedwebsitelogo1.png#100878)


What a Cat Costs Us
July 16, 2025
The Island With No Traffic Lights
July 18, 2025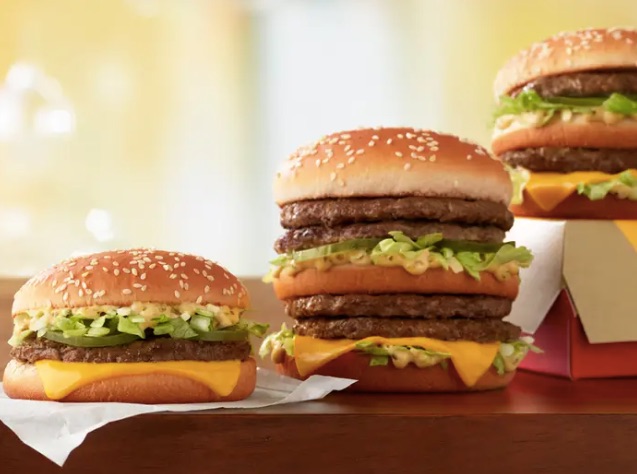
We could call the Big Mac a common denominator.
Almost identical in different nations, the Big Mac is a handy way to compare currencies and wages.
So let’s take a look.
The Big Mac Index
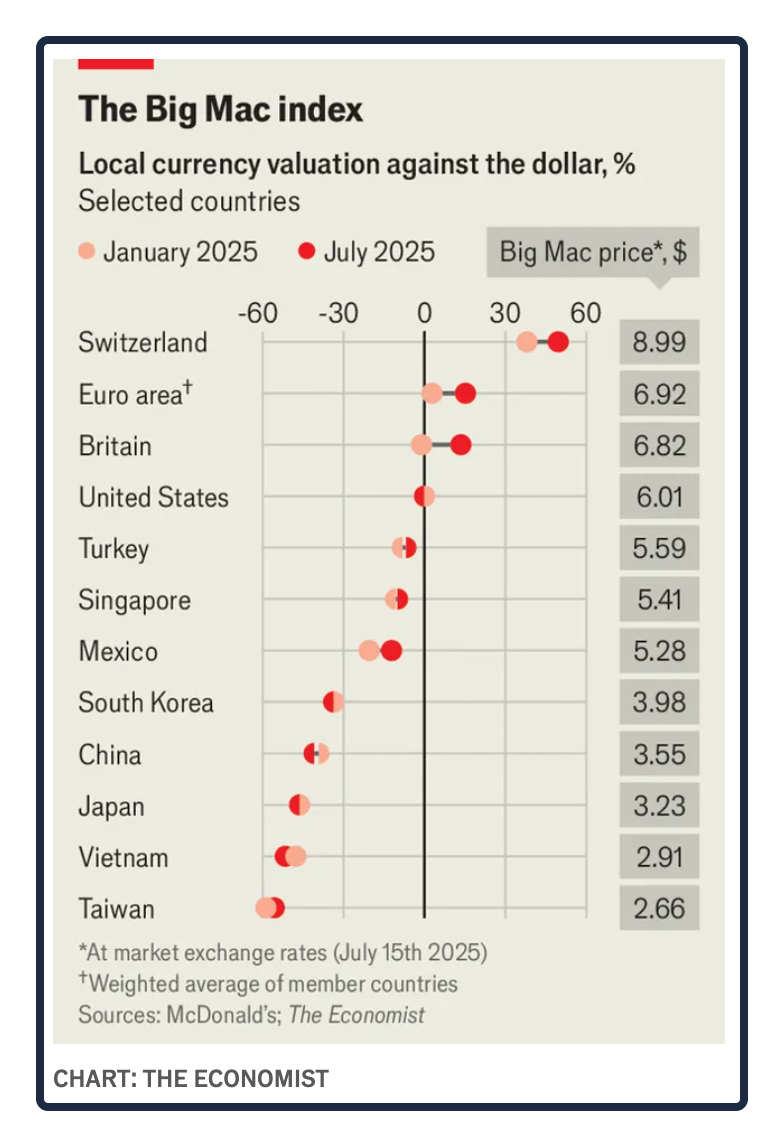
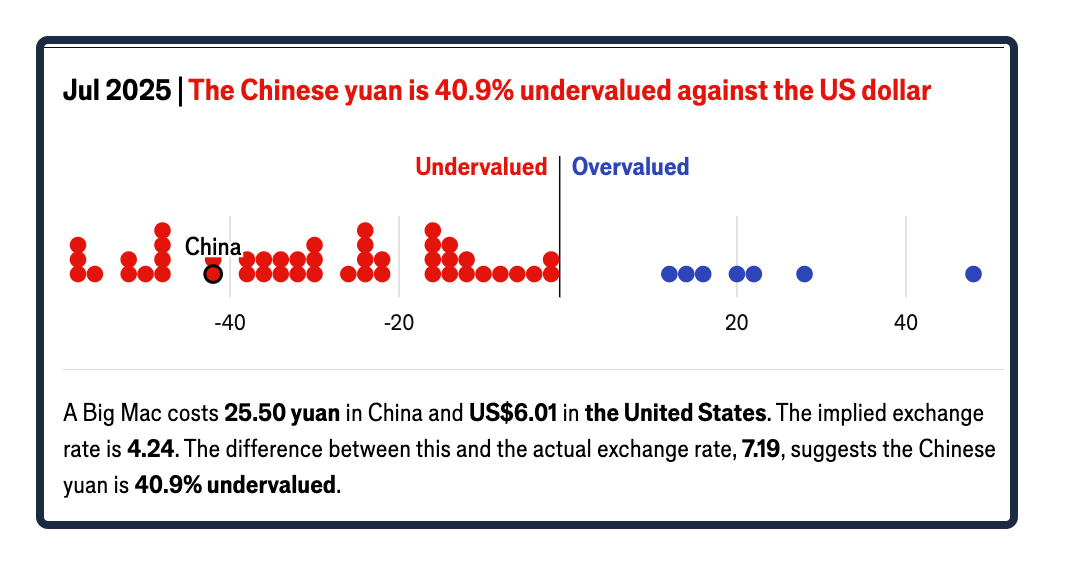
Through its twice-yearly Big Mac Index, The Economist lets us compare currencies with Big Mac prices. In its January report, The Economist told us that the average American Big Mac price was $5.79. Today it is $6.01.
Comparing below, you can see that we will pay a whopping $8.99 for a Big Mac in Switzerland because the Swiss Franc is overvalued by 49.6 percent:
MacWages
Looking at McDonald’s “basic crew” employees, we can compare “apples to apples.” At a Hamburger University campus, you can get a similar education. And, at your local McDonald’s, no matter where, you follow the same operations manual. Or as Princeton economist Orley Ashenfelter and his co-author Štěpán Jurajda explained, you have “standardized capital.”
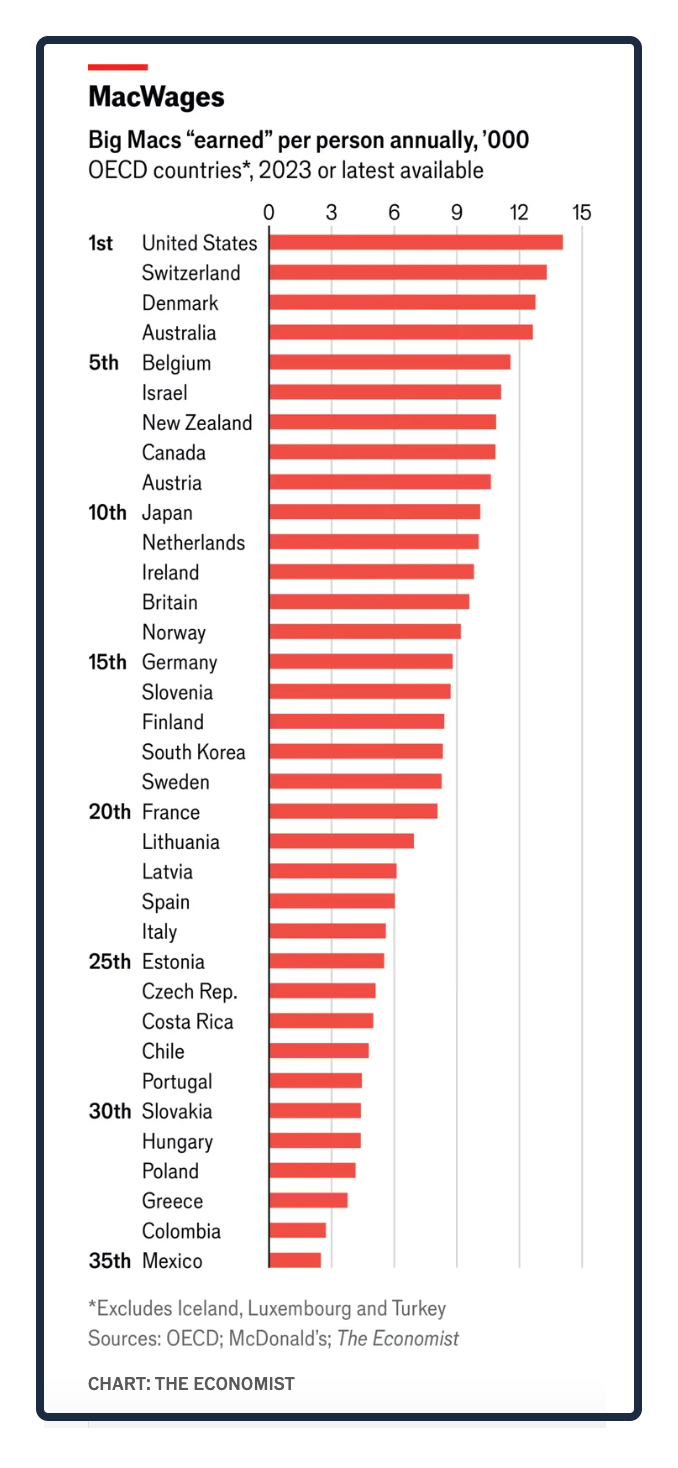
Because those McDonald’s jobs are so similar, we can get a more accurate picture of wage differences. Consequently, we can also ask how many Big Macs a Mac Wage can buy in one year:
At the top of the list, McDonald’s employees could buy close to 14,000 Big Macs annually with their income. By contrast, a Mexican McDonald’s employee would have been able to purchase fewer than 3,000:
Our Bottom Line: Purchasing Power Parity
When we compare economies, it can be helpful to recognize PPP (purchasing power parity) differences. Oversimplifying a bit, PPP is just a comparison of how much a basic currency unit can buy. We know that the U.S. has the world’s biggest GDP. However, through a PPP lens, China’s is larger because of their lower prices. In other words, although GDP totals are less, they can represent more purchasing power.
Using IMF PPP numbers, we see that the United States produced a 14.75% GDP share while China’s slice was 19.68%: Consequently, we could say that China ranks above the U.S. for GDP size:
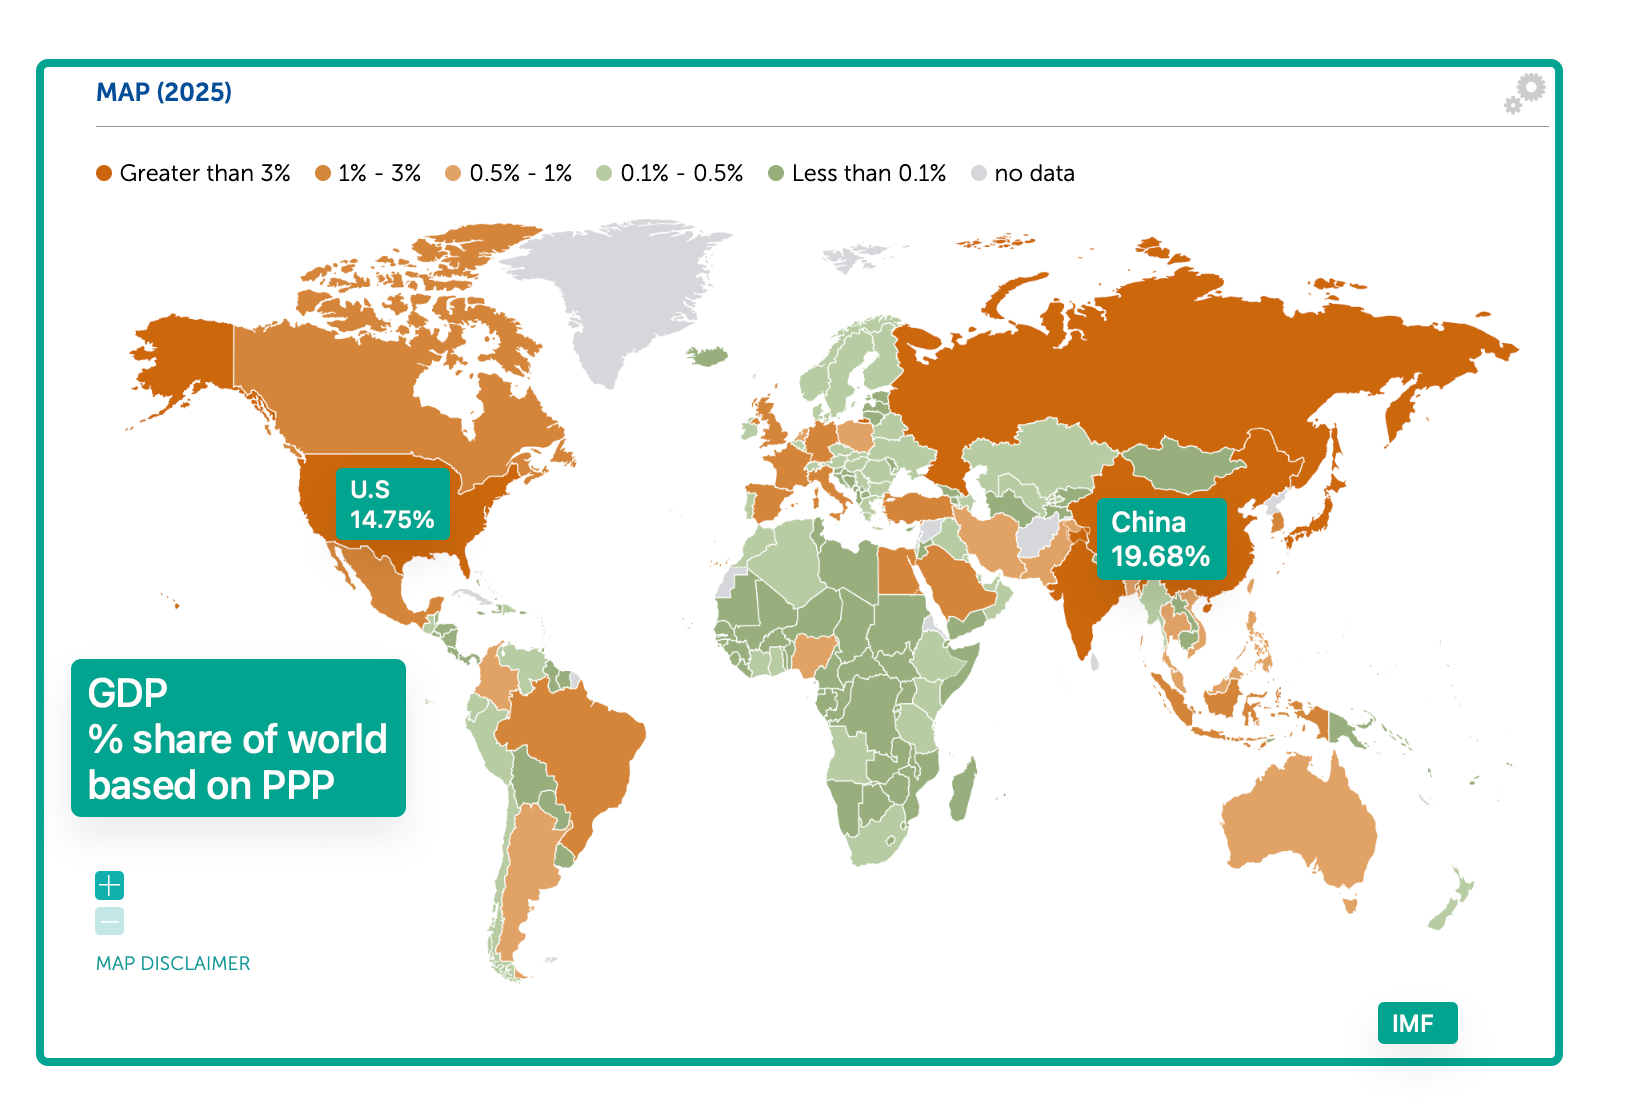
With a Chinese Big Mac priced at (the equivalent of) $3.55, we can see the PPP differences. Giving us more burger for the buck, they have an undervalued currency:
My sources and more: I just realized it was time to go to the Big Mac Index for our twice-yearly look at Burger Economics. From there, we went to the MacWage here and Working Paper 32708 at NBER, and then to the IMF for a PPP look at GDP.
Please note that today’s “Bottom Line” quotes a previous econlife post and the post was edited after publication to correct GDP numbers.
