Our Weekly Economic News Roundup: From a Trade War to the Minimum Wage
February 10, 2024
The Impact of the Swiftie Friendship Bracelet
February 12, 2024It’s tough to measure Mount Everest. Figuring out where sea level starts is not quite clearcut. In the past, Nepal used the Bay of Bengal and wound up with the summit at 29,028 feet while China started with the Yellow Sea and got 29,017. Then, for the position of the peak you have to decide whether to include the snow cover. And, it gets even more complicated because shifting tectonic plates can lift the mountain and earthquakes make it sink.
Now though China and Nepal agree on 29,031.69 feet.
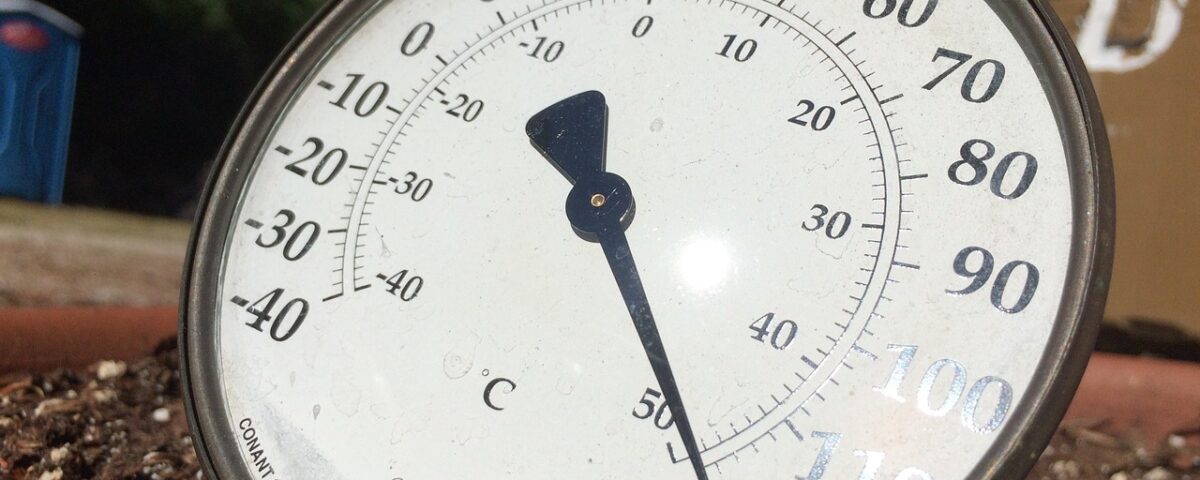
Somewhat similarly, there is lots to figure out when measuring global warming.
Measuring Global Warming
Many of us know that we do not want average global temperatures to increase more than 1.5°C above pre-industrial levels.
However, we have to agree on what “pre-industrial” levels mean. The Intergovernmental Panel on Climate Change (ipcc) uses estimates from 1850-1900. Because they are estimates, scholars use different temperatures as a baseline:

Next, we know we are referring to average global temperatures. There too, there could be several answers. After all, we can use a day, a month, a year, or a decade to calculate average temperatures. While daily averages would not make sense, yearly data also can be misleading. Below, The Economist tells us that including an unusually warm January would have nudged the 2023 average from 1.48°C to above 1.5°C:

Furthermore, El Niño and La Niña create global warming statistical dilemmas because El Niño warms and La Niña cools. So, what to do during those years? As a result, the IPCC says to use a 20-year average. That means though that we will know we’ve exceeded the 1.5°C maximum 20 years after it happened:
Finally, retaining our 20-year metric, we might be able to use current data as a midpoint of 10 years and then project for the next decade what the temperature increase will be. Using current data, we are 1.26°C warmer than pre-industrial levels. But we still have to agree on the 10-year projection. Others suggest we ignore the 20-year benchmark and instead just calculate a trendline:
Our Bottom Line: Misleading Statistics
We need to be wary of precise numbers that masquerade as accurate statistics. Even for a mountain, the height is debatable. And, while global warming data are very different from Mount Everest’s, still, baselines matter.
Always, with posts like today’s I like to return us to the coast of Great Britain, Explained by a classic paper from mathematician Benoit Mandelbrot, the shorter the ruler, the longer the coast:

So, whether it’s global warming or the coast of Great Britain, it all depend on how you measure it.
My sources and more: Thanks to The Economist for my climate change facts and then the NY Times for more insight. Then, this past econlife post had the Mount Everest height debate and, most crucially, these books from Morten Jerven and Charles Wheelan are always good for statistical skepticism.
![econlifelogotrademarkedwebsitelogo[1]](/wp-content/uploads/2024/05/econlifelogotrademarkedwebsitelogo1.png#100878)


