![econlifelogotrademarkedwebsitelogo[1]](/wp-content/uploads/2024/05/econlifelogotrademarkedwebsitelogo1.png#100878)


A Toothpaste Tube Problem
January 5, 2026
What Can Pizza Say About the Pentagon?
January 7, 2026
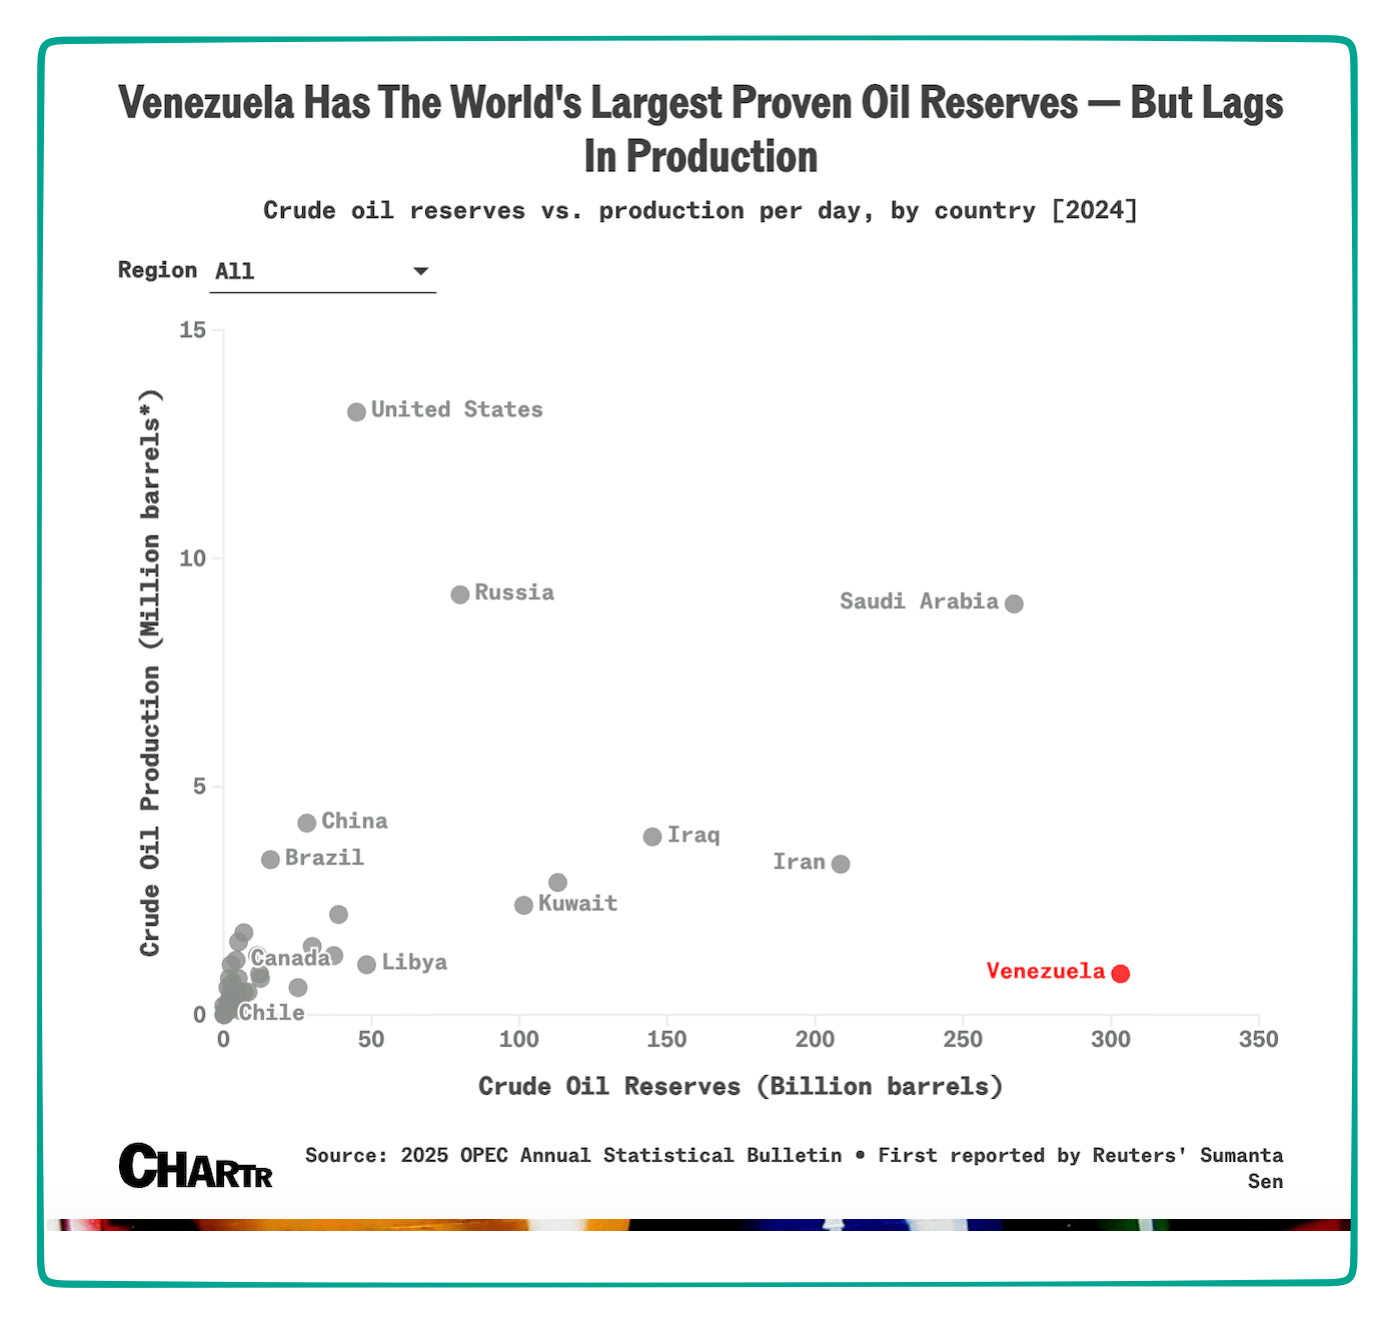
Comparing the size and production of oil reserves, we have Venezuela at the top and near the bottom:
Told that oil markets could change, we can ask about the supply and demand that propels them.
Oil Supply and Demand
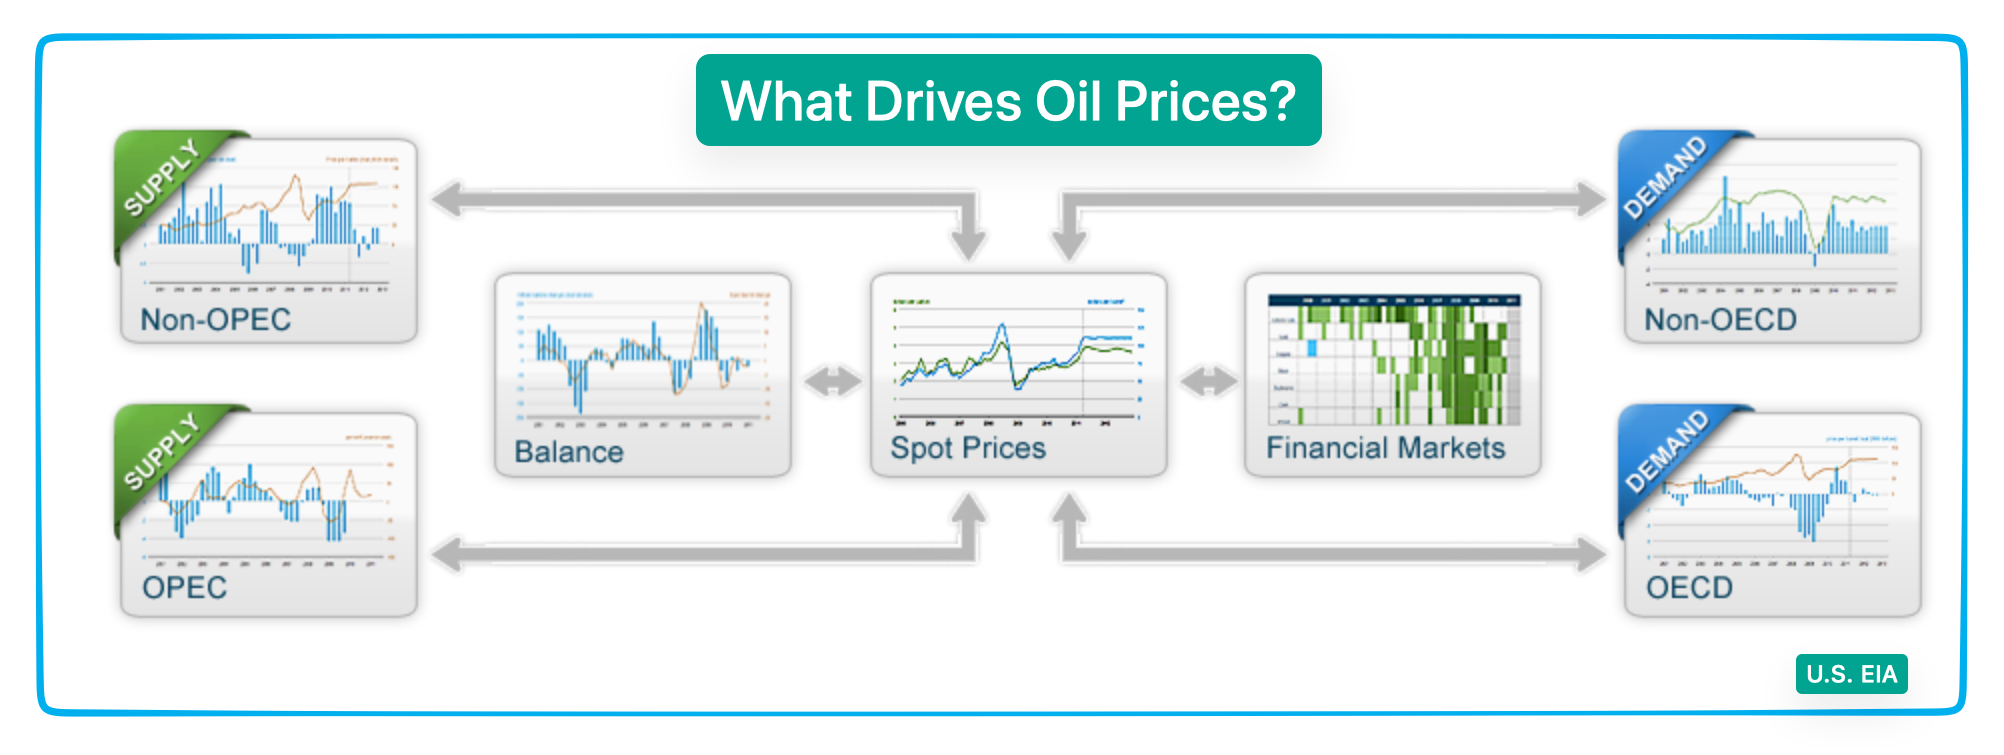
The U.S. EIA (U.S. Energy Information Administration) asked What drives oil prices? The answers provide insight about the allure of Venezuelan oil.
They take us to supply and demand:
Supply
OPEC and OPEC+ (Organization of Petroleum Exporting Countries)
Although we have a 2023 graphic, the major numbers remain close to accurate:
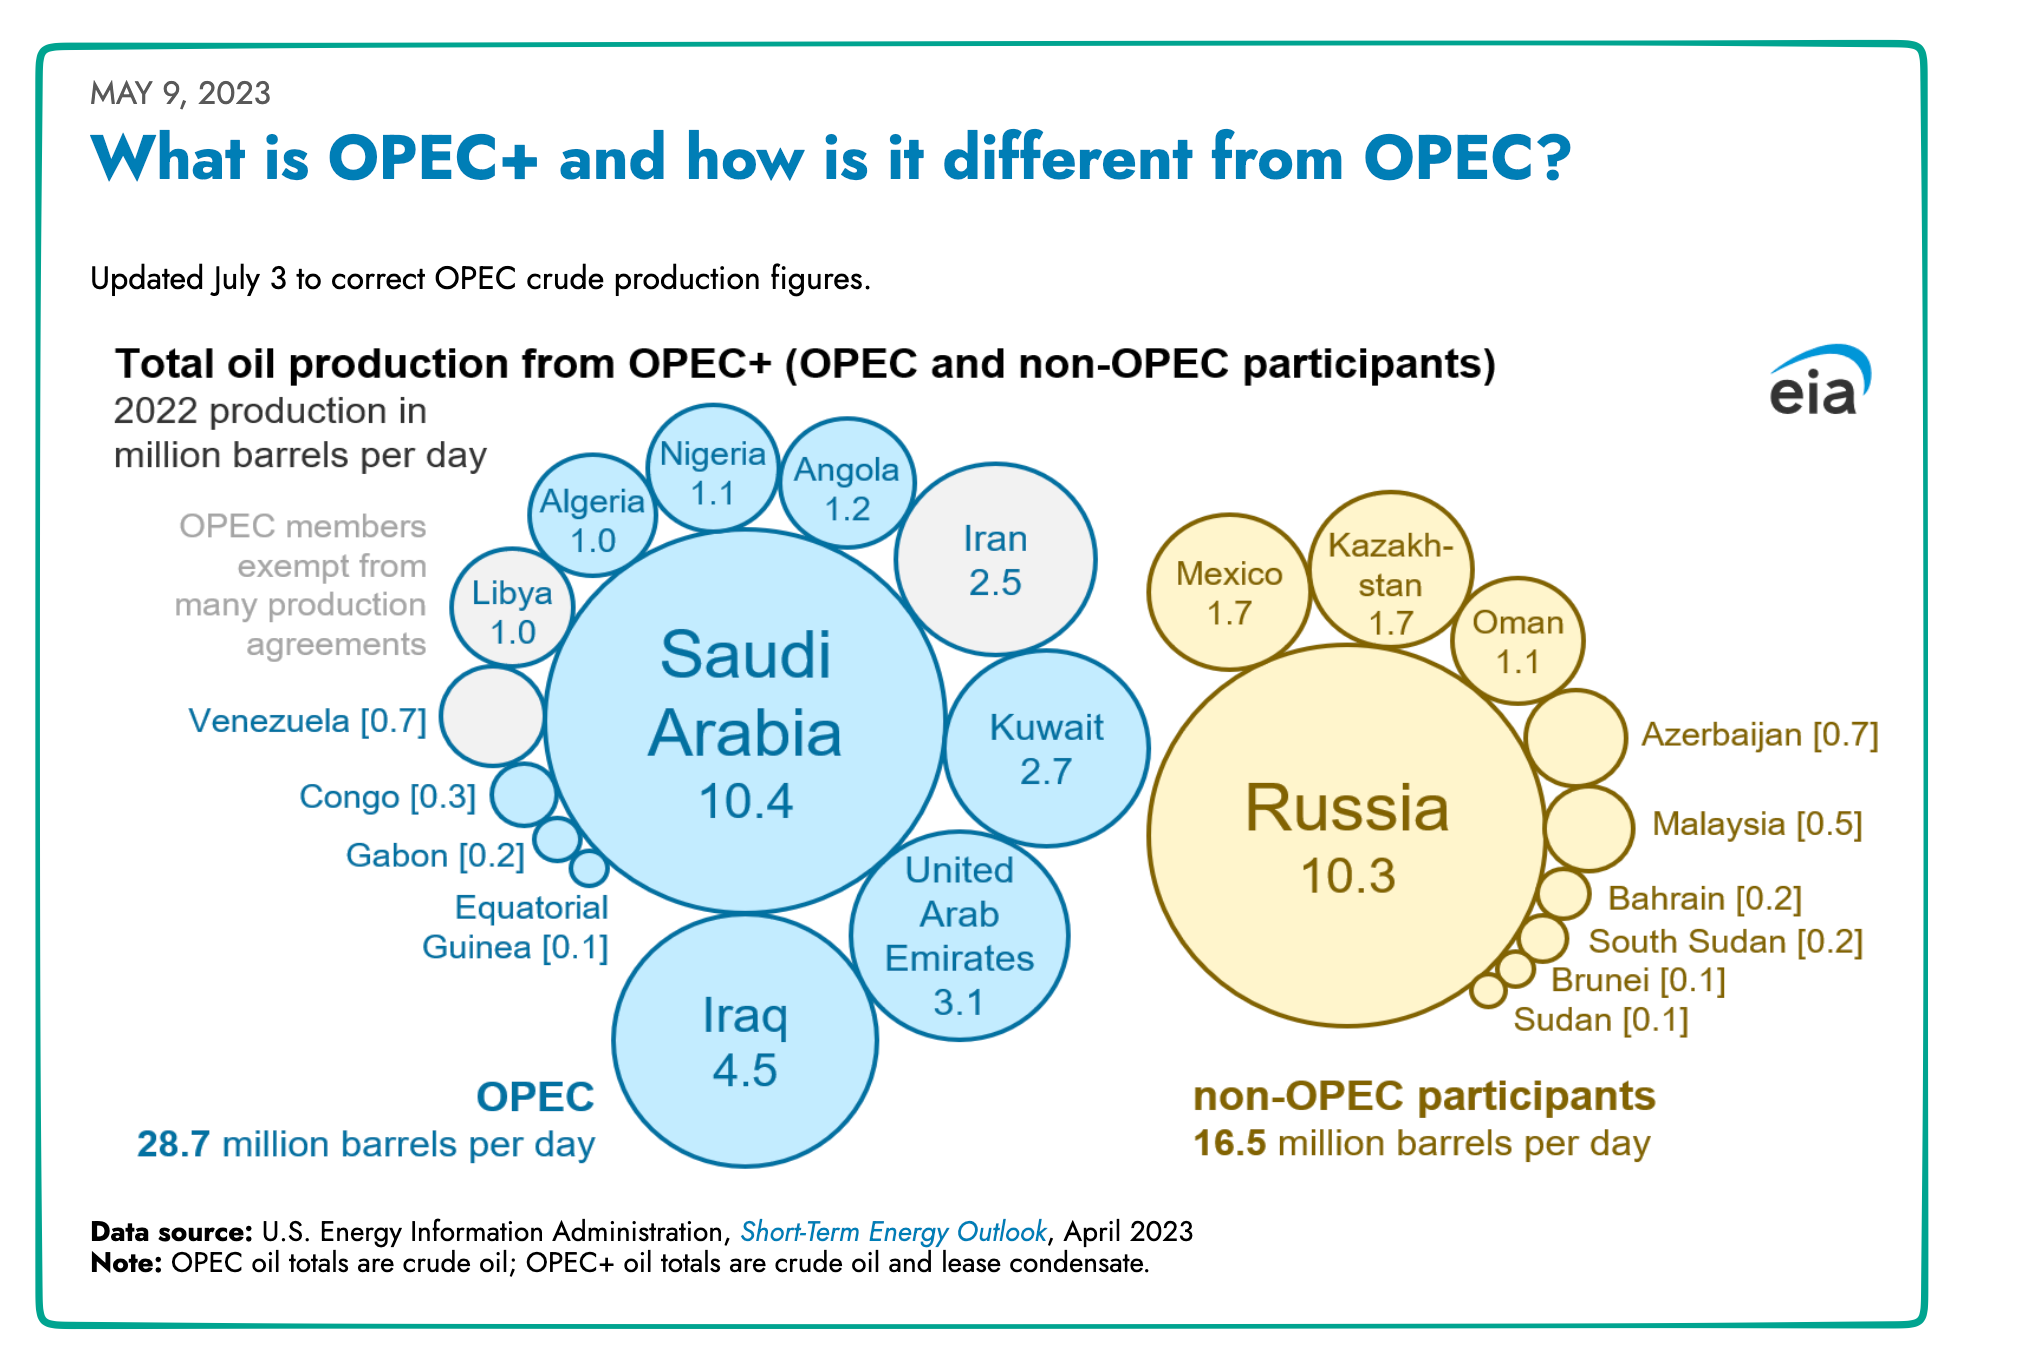
Providing close to 50% of the world’s oil, OPEC and OPEC+ countries try to coordinate output. The EIA tells us that spare capacity–extra available crude–“dampens or amplifies” crude price fluctuations. Recognizing Venezuela’s limited production capability, you can guess the impact of any increase on spare capacity.
Non-OPEC (and not an OPEC participant):
Meanwhile, the other half of the world’s oil comes from the non-OPEC nations like the U.S. and North Sea nations. Described by the EIA as price takers, these producers function independently. Because investing decisions play a larger role, this group responds to traditional supply and demand variables.
Demand
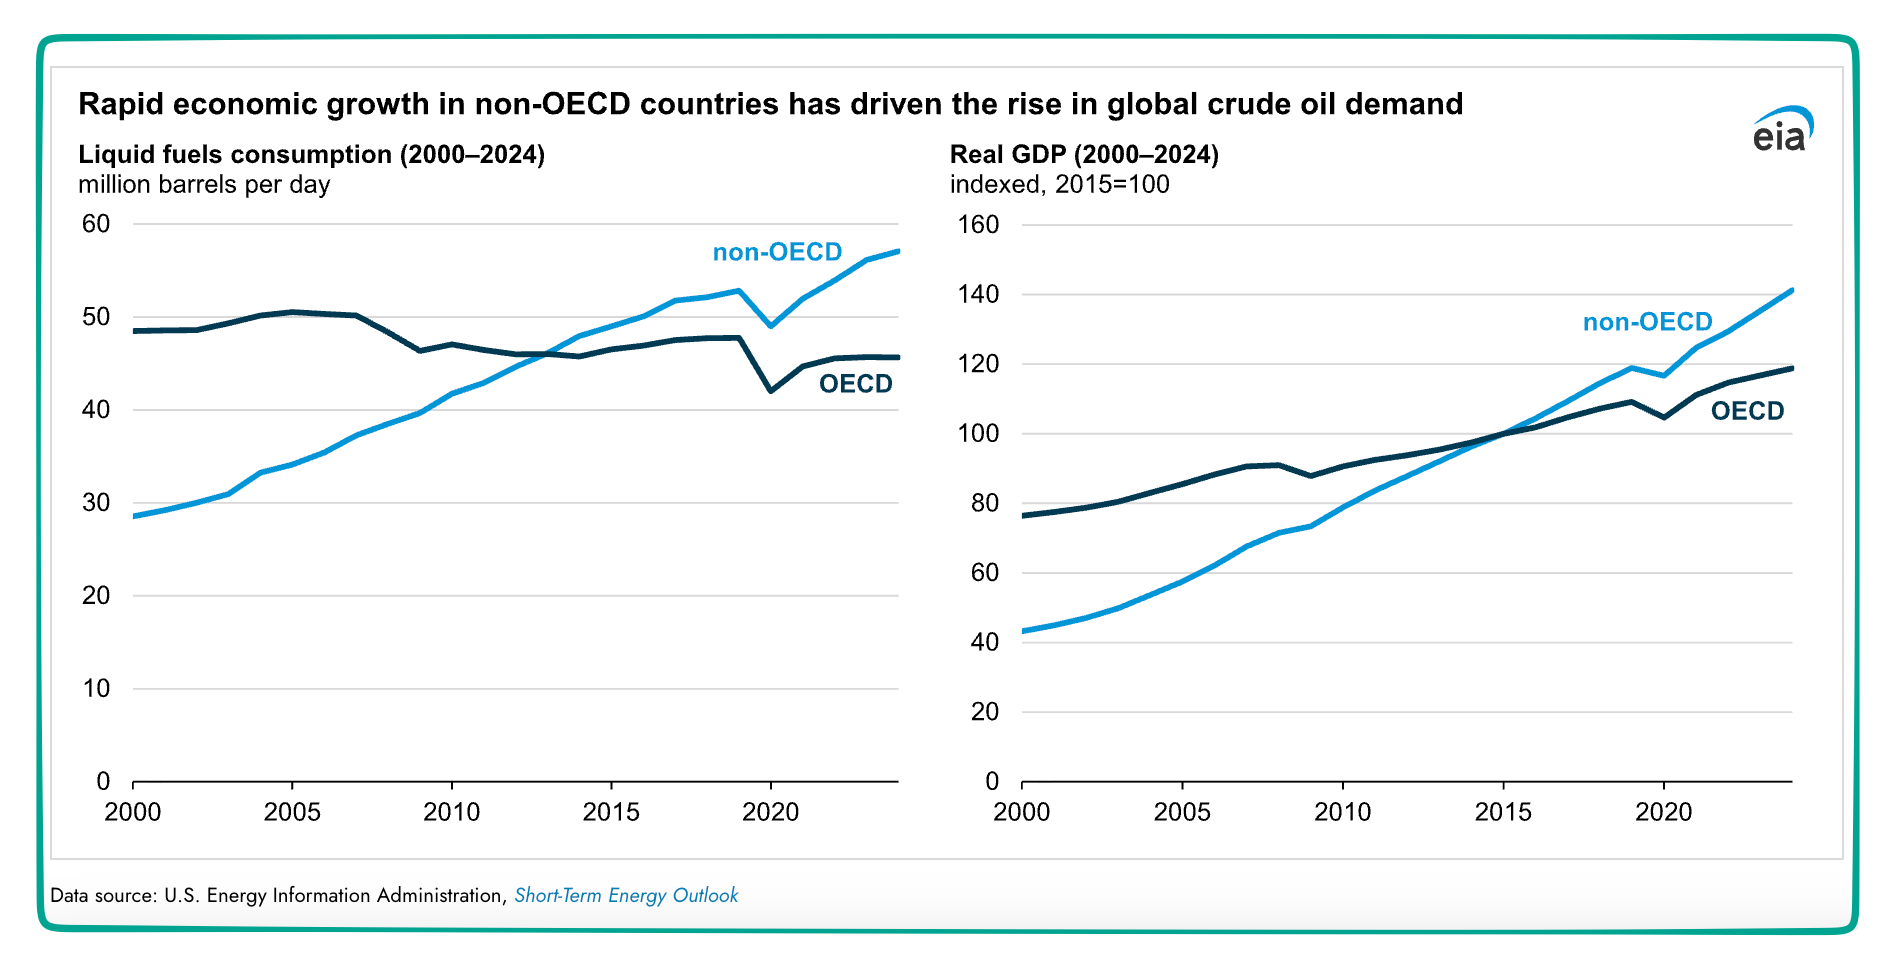
On the demand side of oil markets, we have the OECD and non-OECD countries.
OECD (Organization of Economic Cooperation and Development)
The OECD group is composed of the more affluent segment of the world. Including the United States, Europe, and other developed nations, they represent close 46% of the world’s oil consumption. While the wealthier segment of the world certainly affects prices through their changes in demand, they tend to be more stable.
non-OECD
By contrast, the non-OECD nations, mostly in Asia, need more and more oil to fuel their growing manufacturing, transportation, and industrial initiatives:
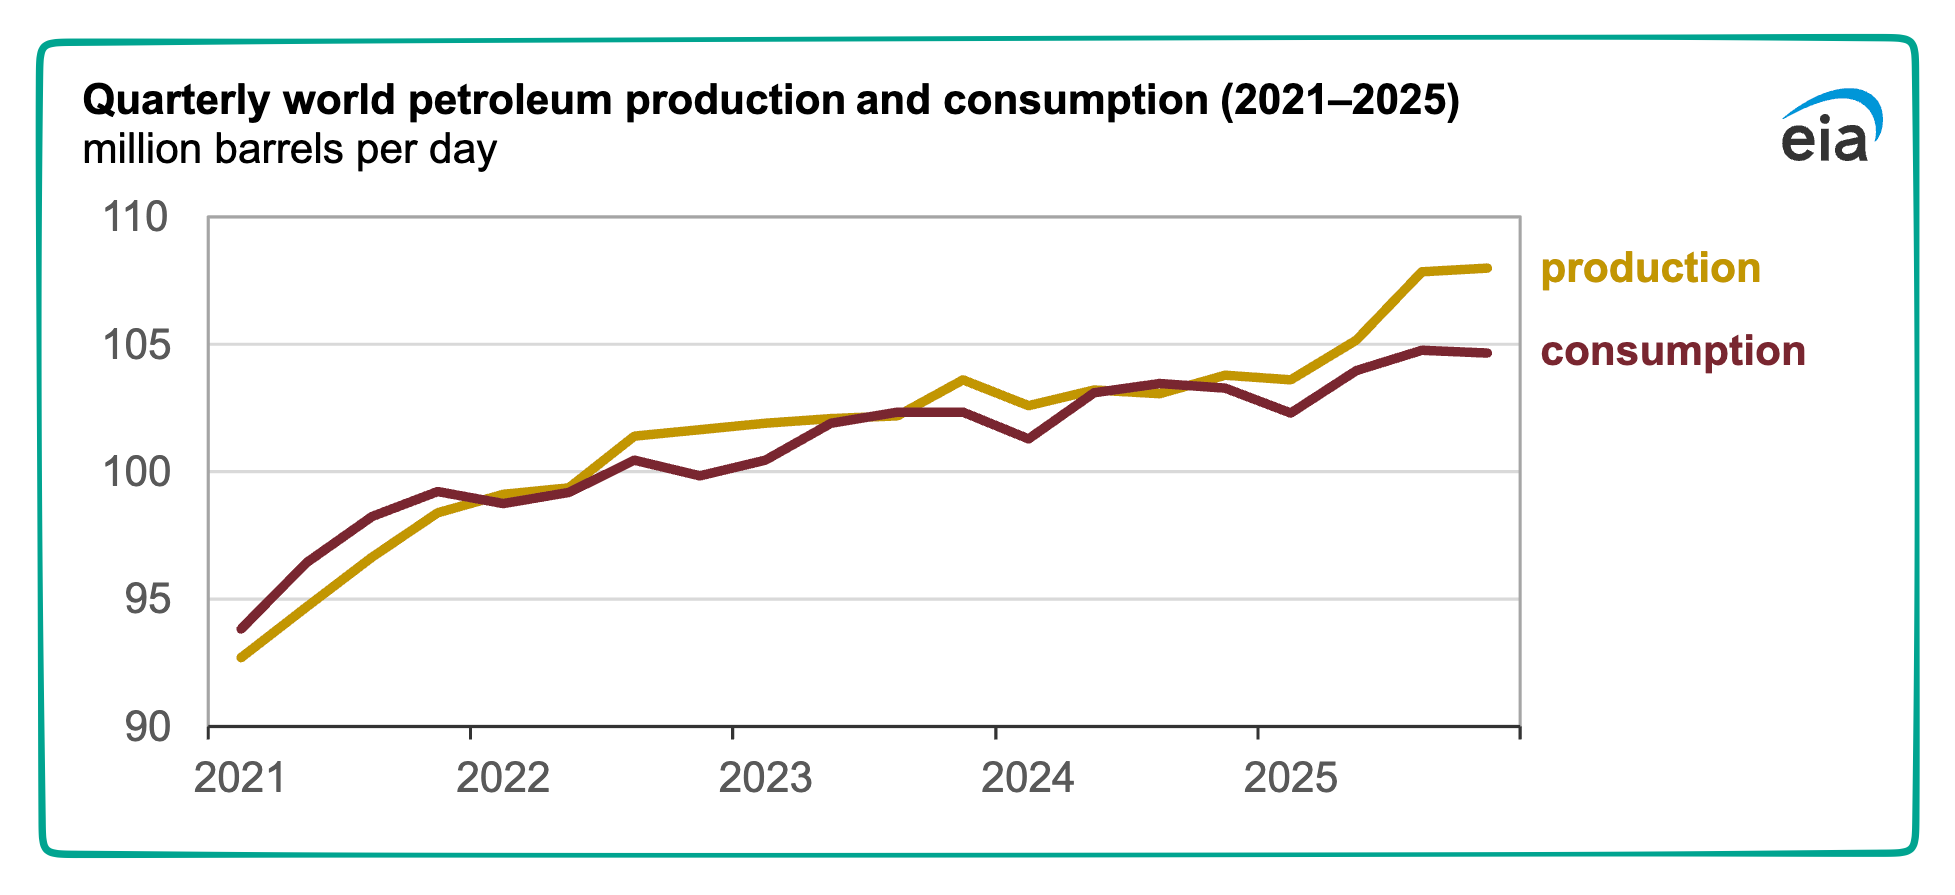
Our Bottom Line: The Power of the Market
Reflecting the power of the market, these two graphs say it all. They show us a supply glut and a plunging price. Consequently, we can ask if the power of the market’s supply and demand will restrain Venezuelan oil investment.
Supply glut:
Plunging price:
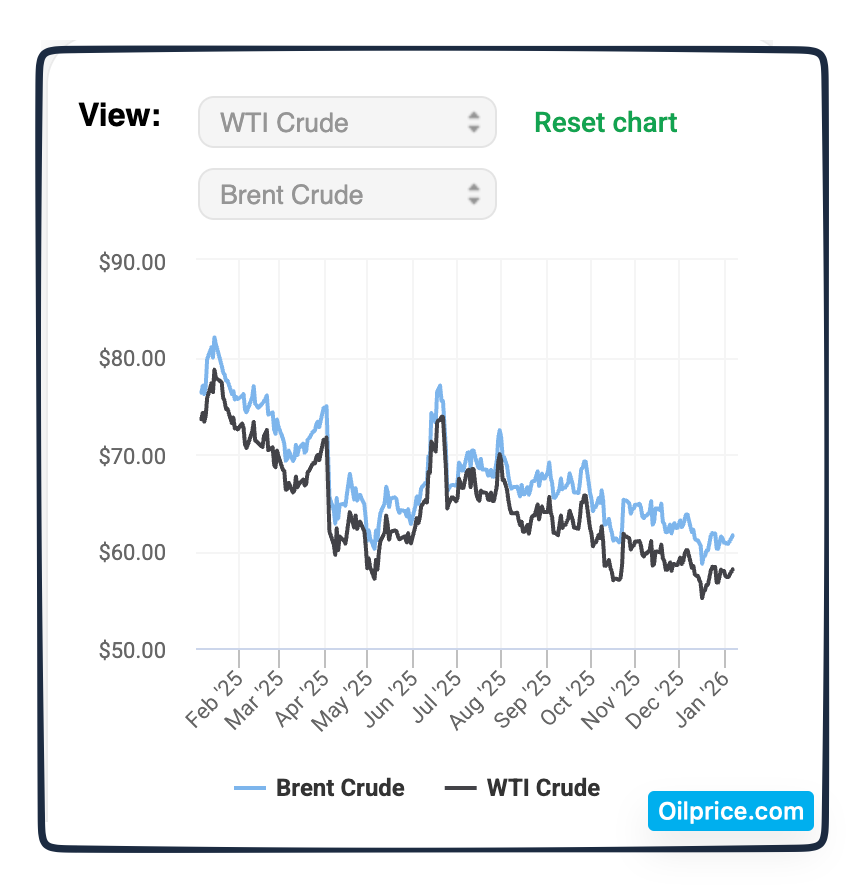
Returning to where we began, you can see that all of the graphic’s arrows lead to the spot prices with which we end.
My sources and more: We’ve accessed most facts from the EIA graphics and text that are here, here, and here while Sherwood news came in handy for the reserves graph. Then, so very relevant, Reuters looked at how and why producers respond to price dips.

