![econlifelogotrademarkedwebsitelogo[1]](/wp-content/uploads/2024/05/econlifelogotrademarkedwebsitelogo1.png#100878)


Why a Noisy Ship Is Like a Food Bank
October 7, 2025
Where Soybean Markets Have Shifted
October 9, 2025
Berries can be a “parent’s nightmare.” Expensive, easy to gobble, and loved by kids, they occupy a disproportionate slice of a family’s food bill.
Let’s take a look.
Food Spending
Berries
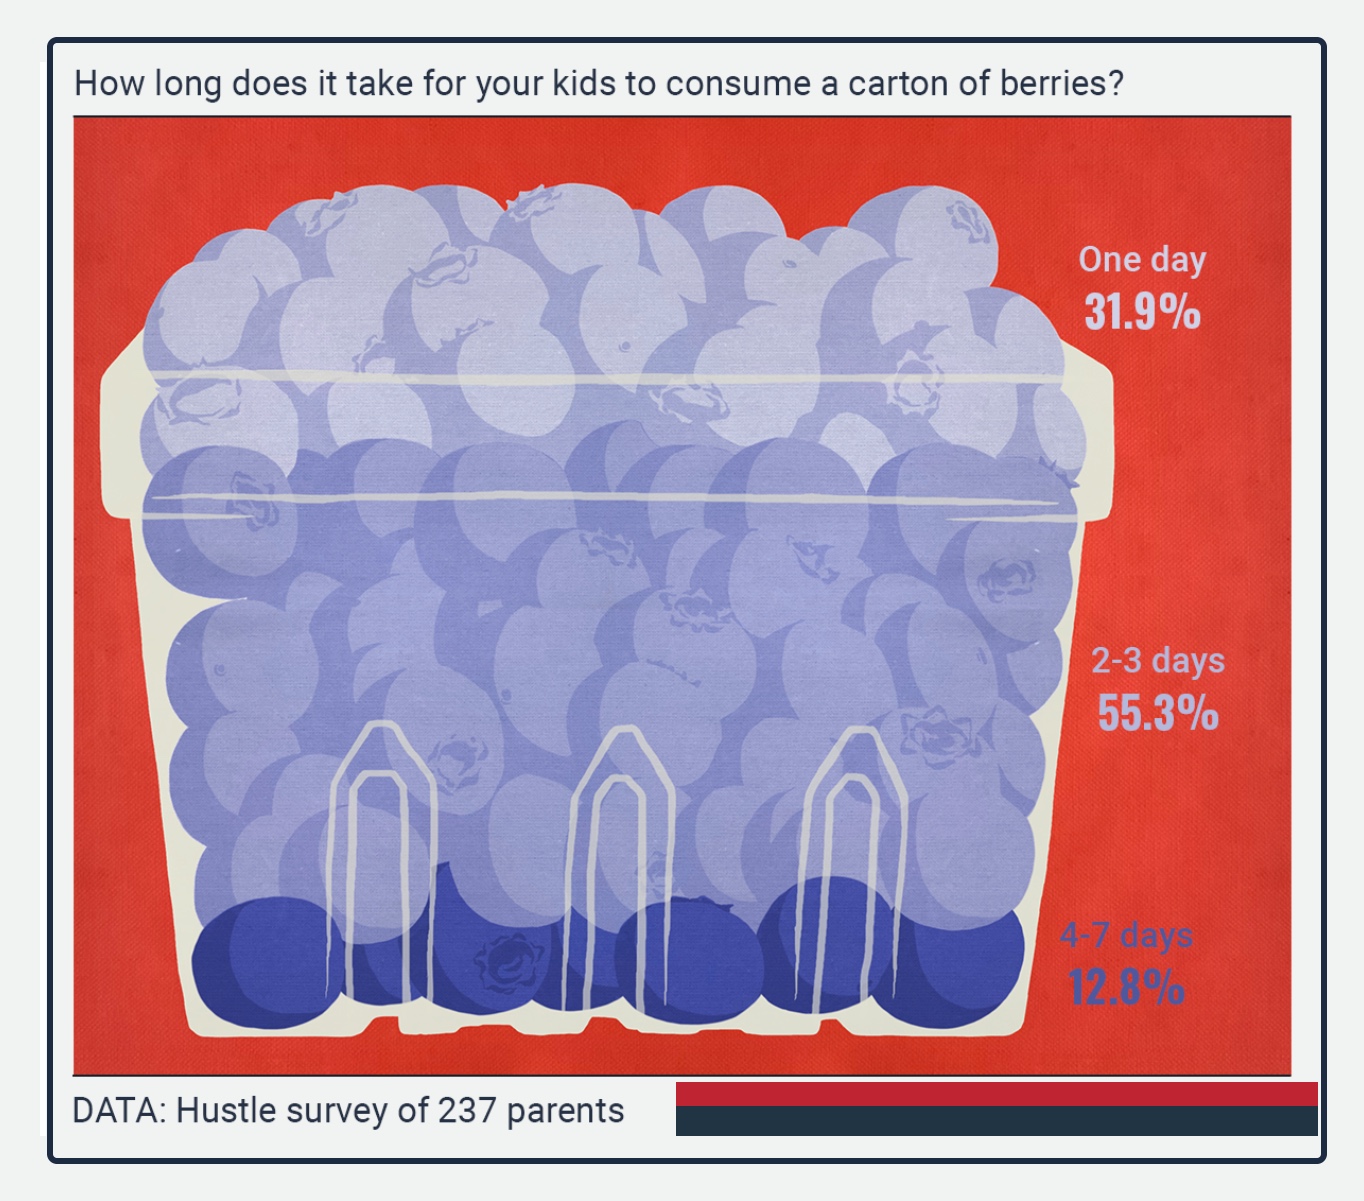
In The Hustle’s unscientific survey, 237 parents said they spent as much as $200 a month on berries while the average was $53. Meanwhile it was not unusual for kids to consume a pint a day:
Moving to fresh fruit sales, we would see that, more than apples, melons, bananas, and pears, berries are #1. Also though, at 3 times the price of an apple and even 10 times what we pay for a banana, they are more expensive.
At-Home Food
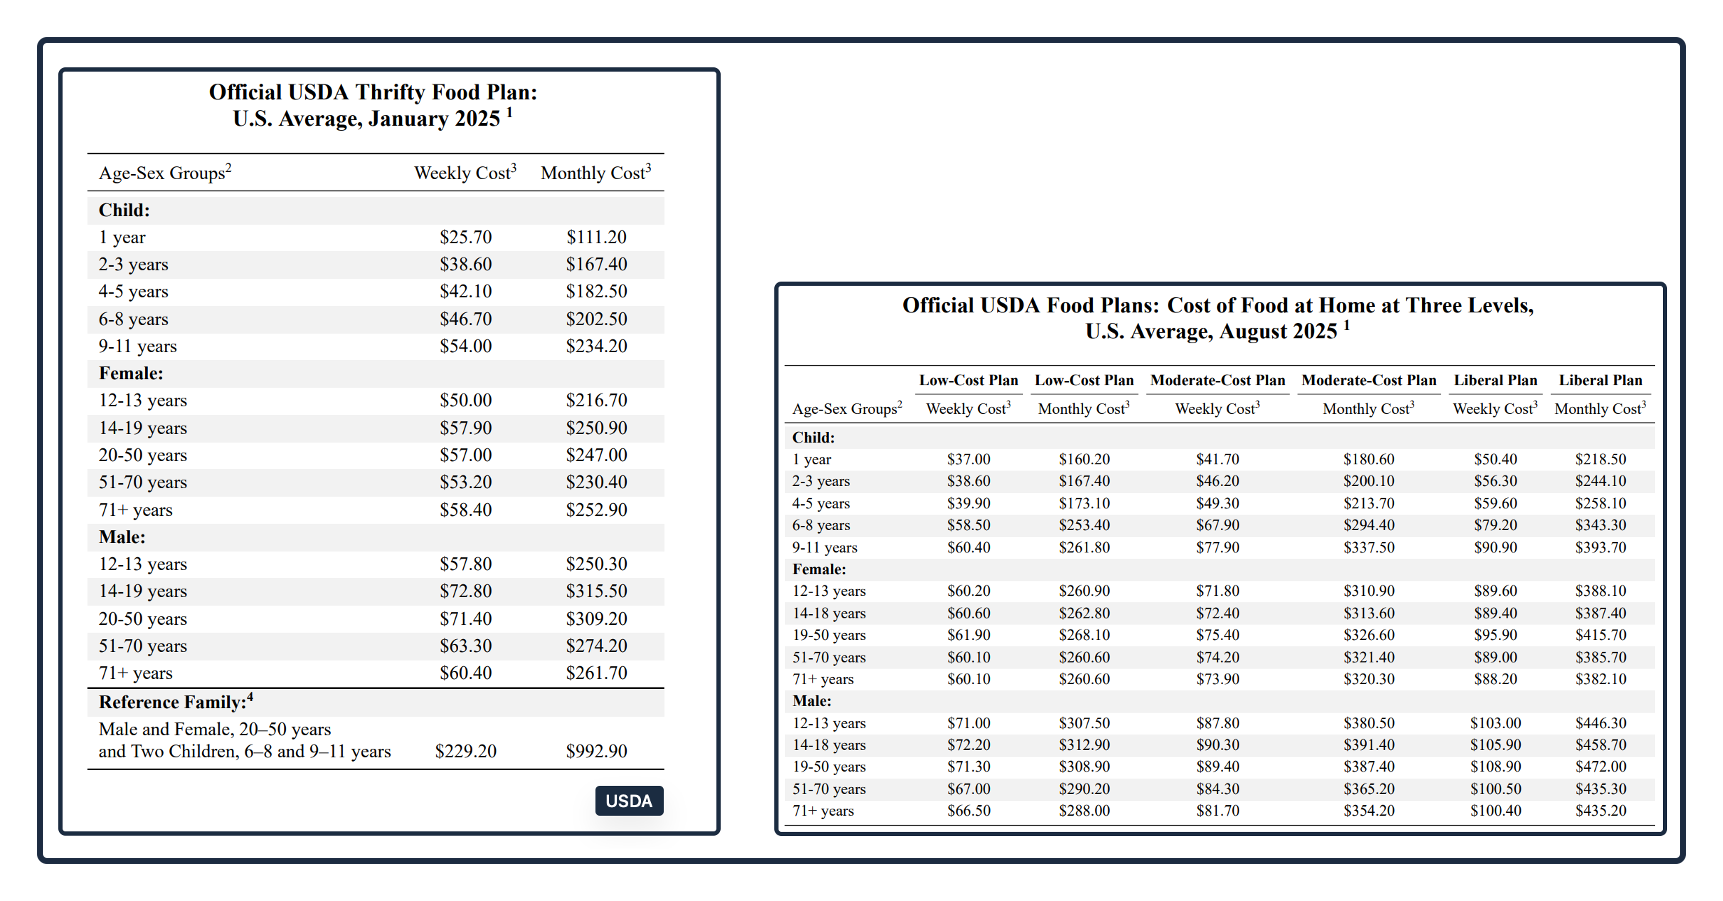
As always, it becomes more complicated when we take a closer look because what we spend could depend on our income quartile. The USDA has even suggested thrifty, low-cost, moderate-cost, or liberal food plans. They give us a good idea of how much we spend on food:
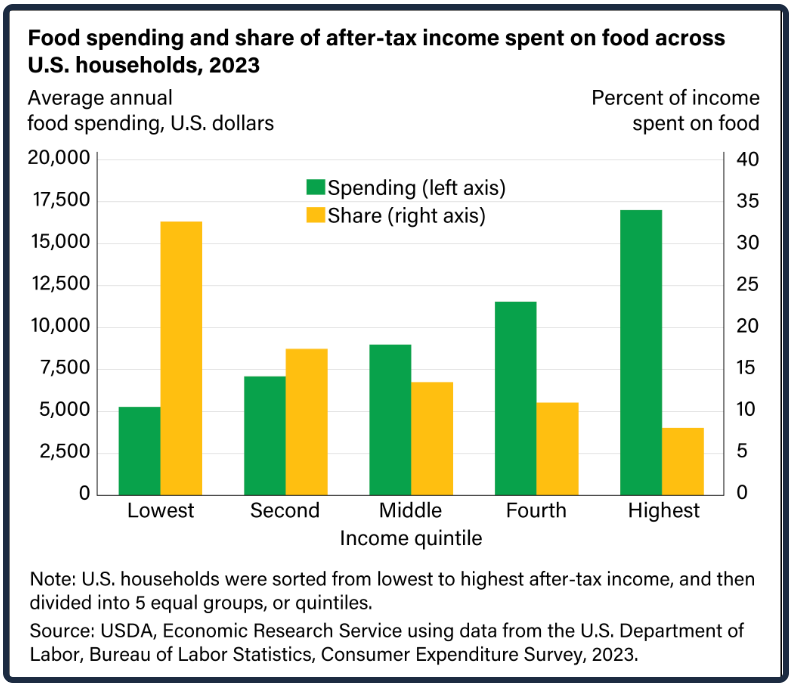
Below we can see an inverse relationship between what we earn and the proportion spent on food. As the green bar grows, the yellow one shrinks:
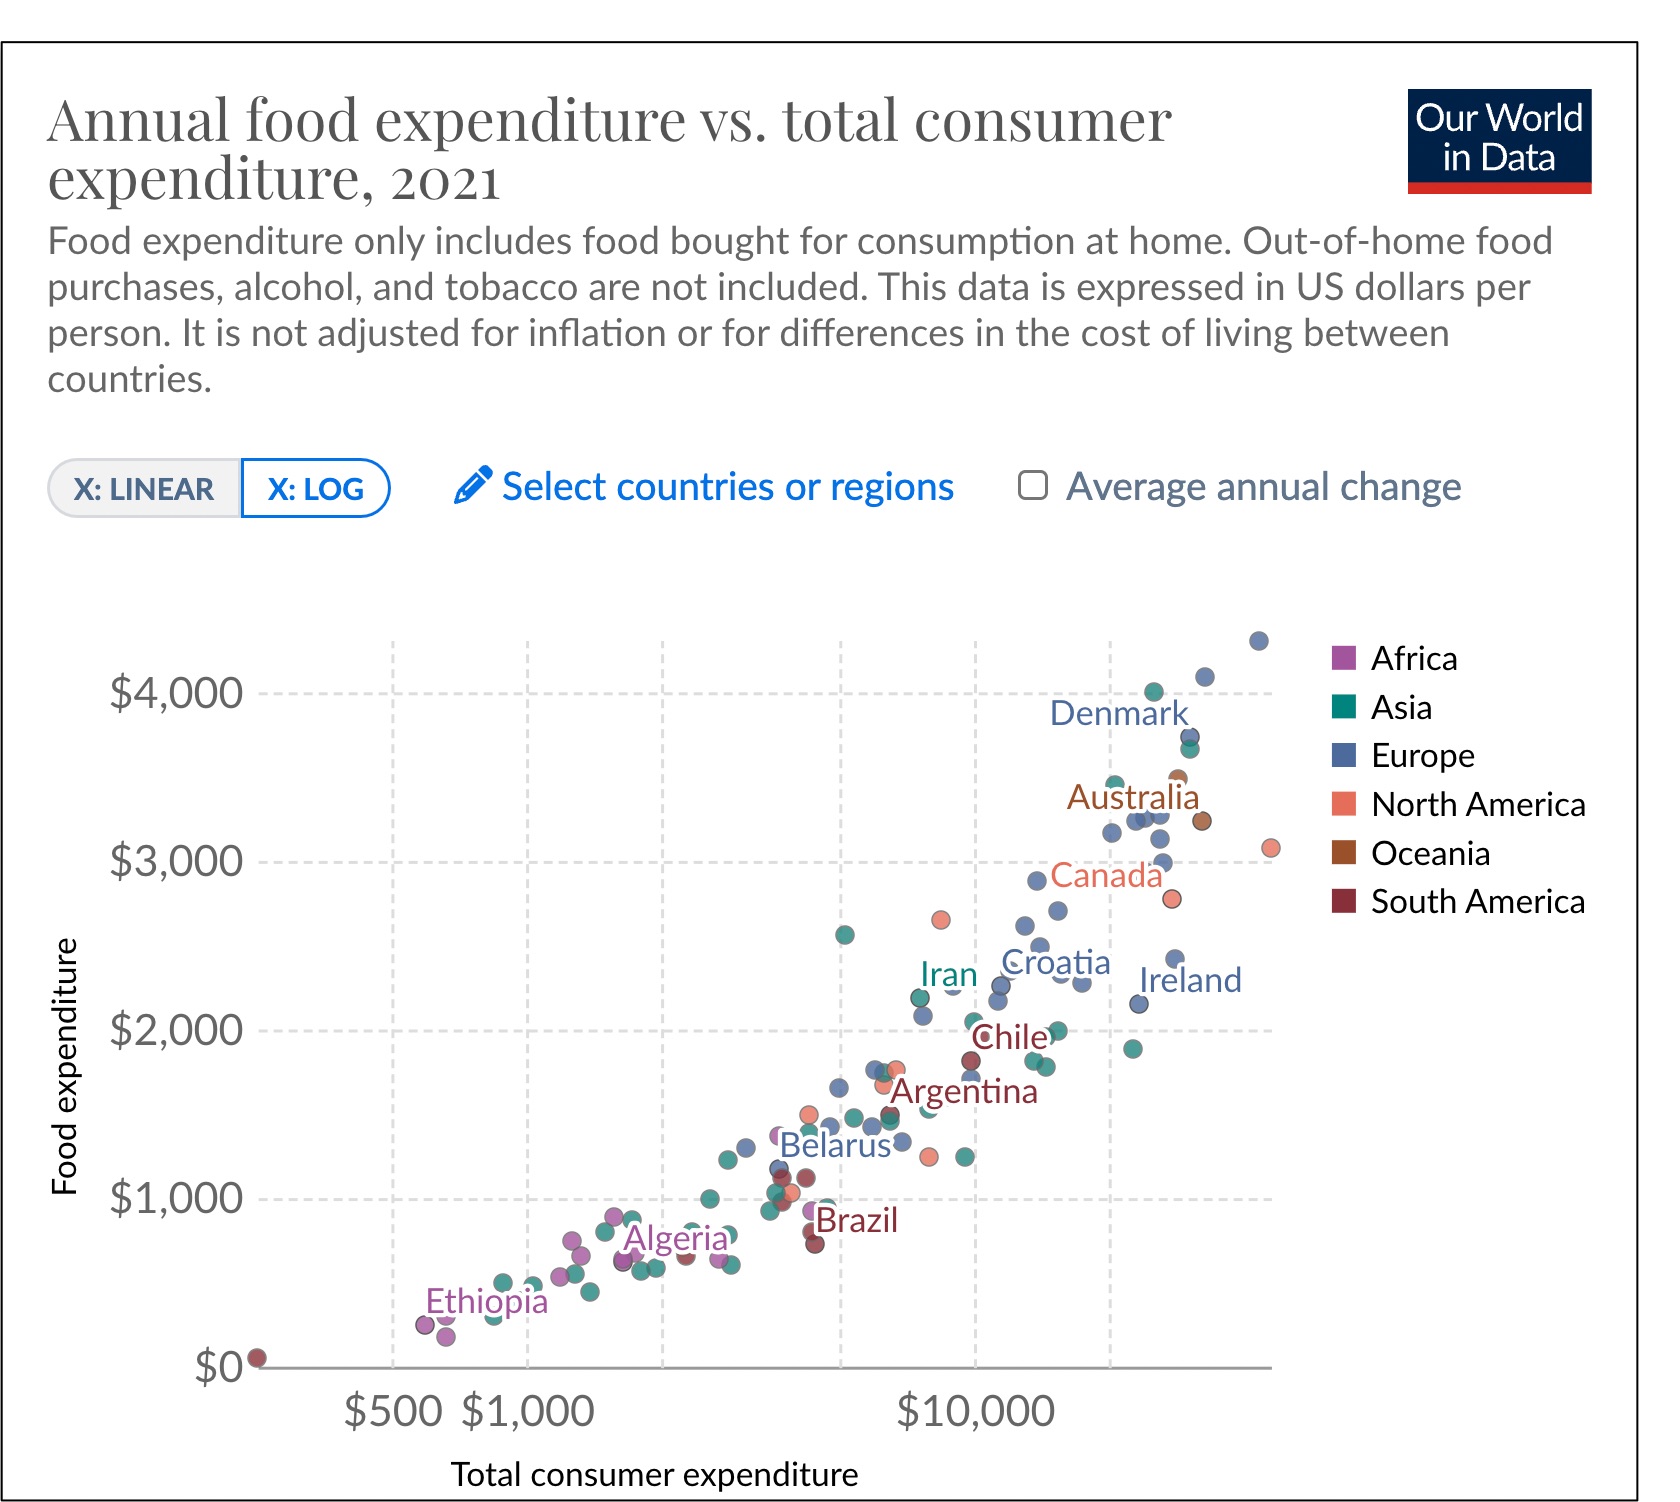
Similarly, comparing at-home food expenditures globally, we see a pretty consistent national income correlation:
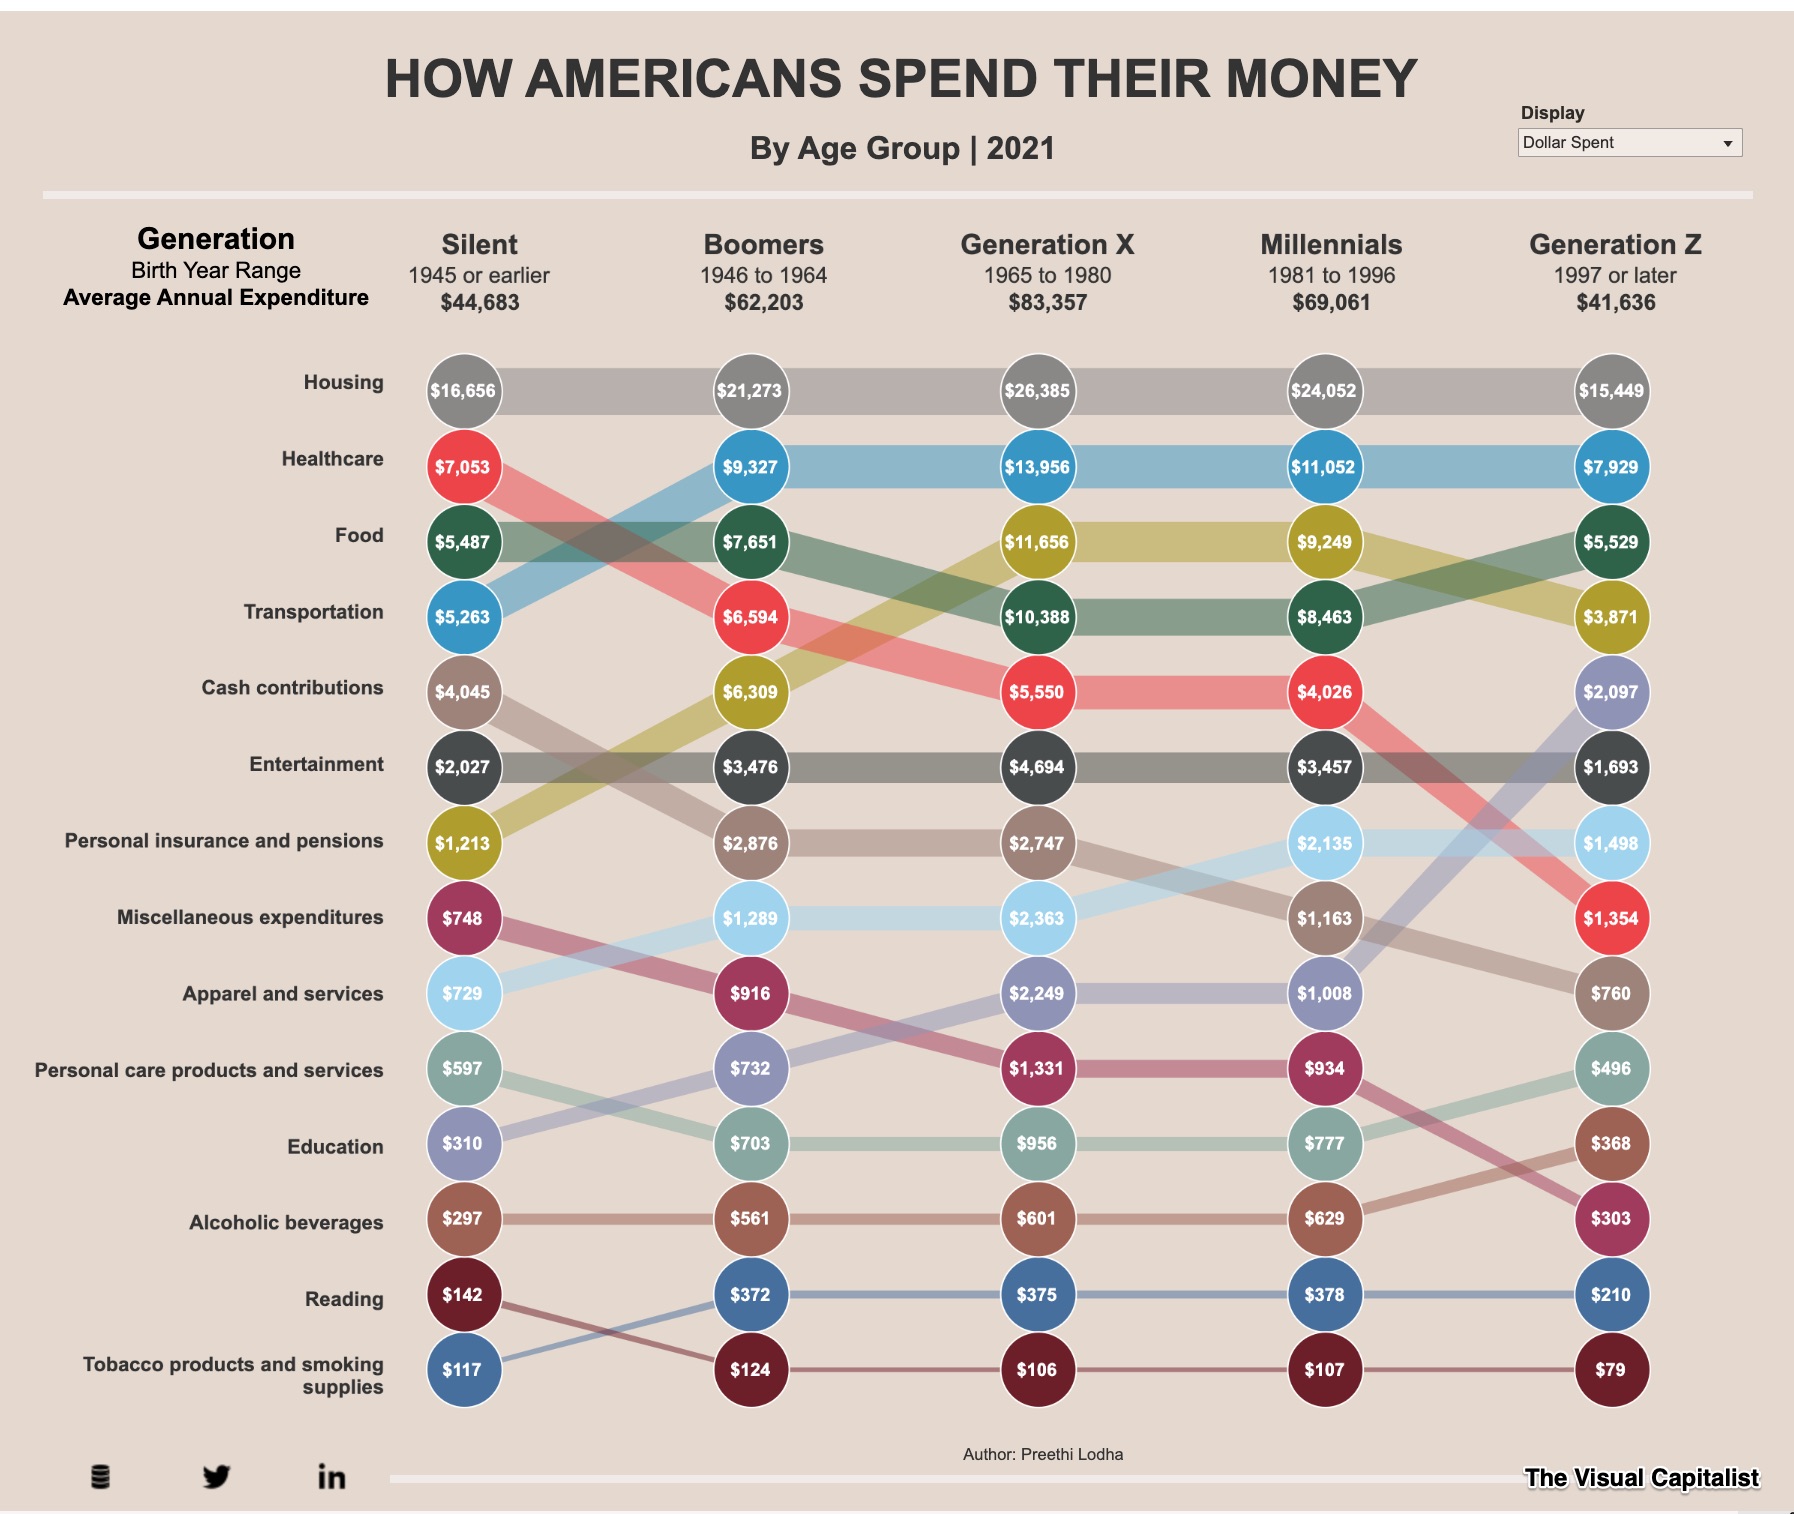
But also, our age matters. As the third item (below) among our household spending categories, food outlays are highest for Gen X but #4 on their list. However, while the amounts are smaller, food occupies a larger proportion of the Silent Gen and Boomers’ spending.:
Our Bottom Line: Engel’s Law
Wonderfully uncluttered and clear, Engel’s Law gives us a thread that ties together all we have said about food and spending:
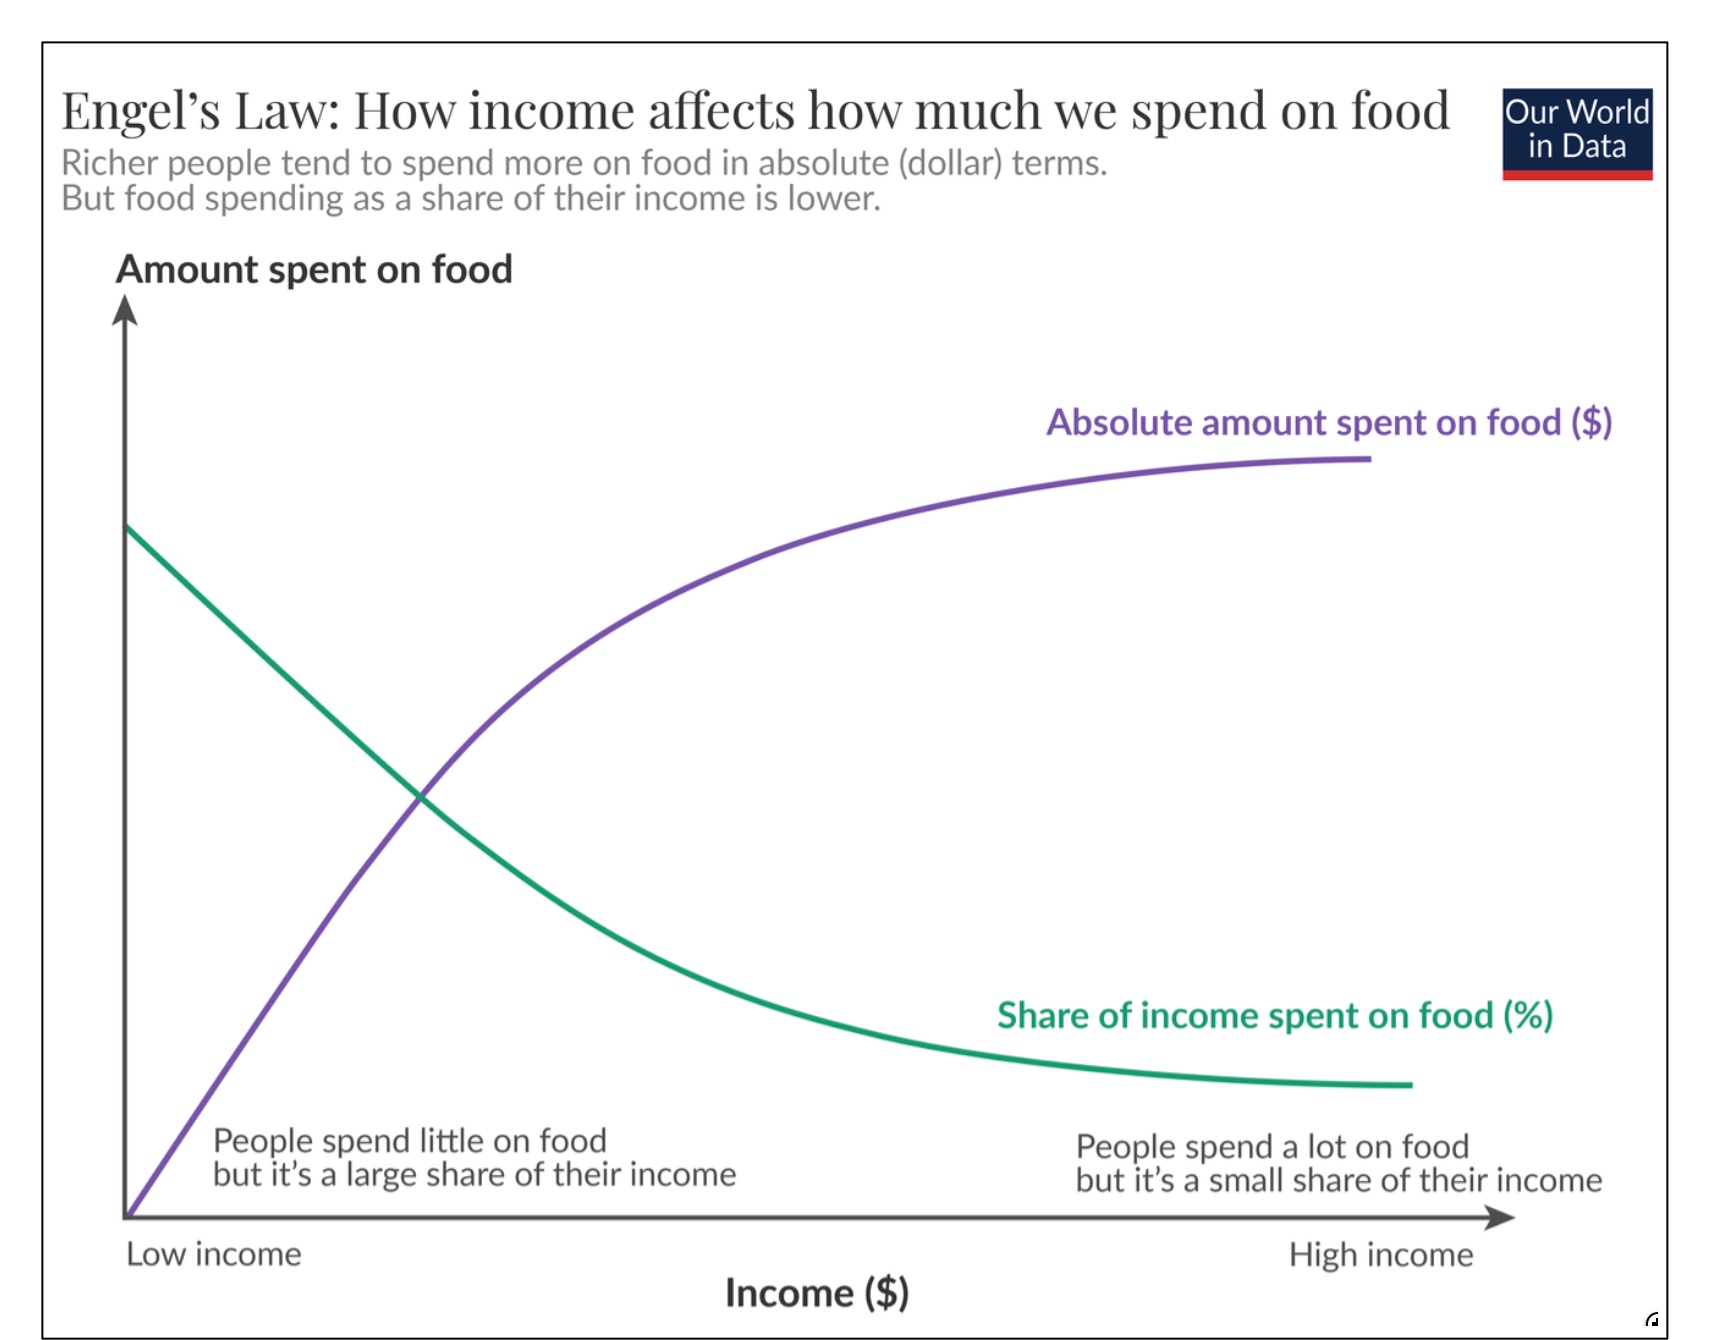
Engel’s Law tells us that while higher income households spend more on food, it occupies a smaller proportion of their total consumer spending. As a result, shown in our geography and income graphics, lower income correlates with less food spending. Also though, in lower income households, food spending is relatively higher. In addition, the food menu changes. When consumers spend less on food, they tend to have less varied, less healthy diets that rely on cheaper crops like cereals and tubers. Then, with more affluence, we are able to add berries.
My sources and more: HT to The Hustle for inspiring today’s post. Next, these USDA food spending statistics and food plans came in handy. And that led me to the graphics at the Visual Capitalist and Our World in Data.
Please note that several of today’s sentences were in a past econlife blog.


