![econlifelogotrademarkedwebsitelogo[1]](/wp-content/uploads/2024/05/econlifelogotrademarkedwebsitelogo1.png#100878)


Why We Could Need 70,000 Bugs and 150 Million Pounds of Beet Juice
July 30, 2025
How to Fight a Chicken Wrap War
August 1, 2025
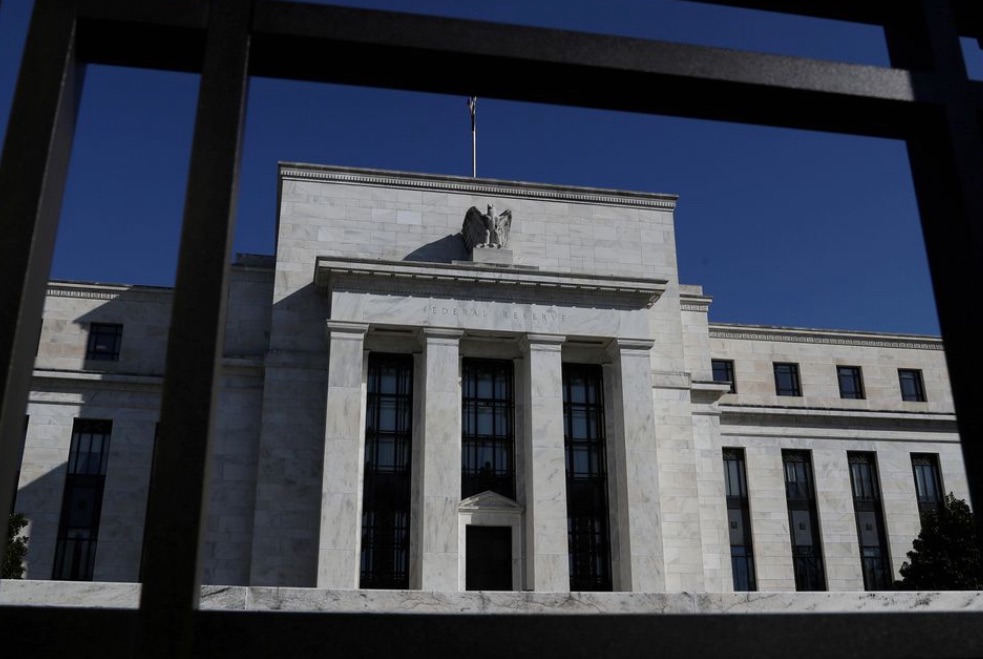
After two days of Federal Reserve meetings, Fed Chair Jerome Powell announced that rates remained unchanged.
Wondering what the Federal Reserve will do in the future, we can look at their dot plots.
Dot Plots
The Fed’s dot plots tell us how the 19 Federal Reserve members feel about short-term interest rates. The dots display what members believe is the most appropriate rate for achieving their inflation and unemployment goals. The key word is “appropriate.” If a member is “hawkish,” she could project higher rates than a “dove” who expects less inflation.
Some dots are more meaningful than others. The one from the Fed chair has more policy power than those from the 12 bank presidents. In addition, only the seven-member board of governors, the NY bank head, and four reserve bank presidents that compose the FOMC vote on policy. However, because the dots are unmarked, we don’t know who did which one.
Below, you can see the most recent dot plot. The date is June because dot plots are released quarterly. Also, different from what Fidelity appears to say below, the 19 dots are from all Fed members:

And these are the economic projections on which the dots are based:

The positions of the 19 dots reflect the disparate opinions of the Chair, the Board of Governors, and the Bank presidents. My take is that they are trending downwards. Your opinion?
Our Bottom Line: FOMC
Composed of 12 voting members, the FOMC determines interest rate policy:

However, they target a fed funds rate–a bank-to-bank lending rate– because they cannot actually set the rate. Instead, by injecting more or less money into the economy, they try to incentivize banks to lower or raise their lending rates.
You can see that the fed funds rate was close to zero and then increased during March 2022 when it had to fight 8.5% inflation. More recently though, with the inflation rate heading downward to a 2% target, the Fed might soon lower its target rate.

We can use our dot plot to guess if and when rates will change.
My sources and more: The Fed was my source of the June dot plots and the economic data table. Also, it could come in handy to look at the Fed’s description of what it does. Please note that several of today’s sentences were in a previous econlife post.


