Our Sunday Charts
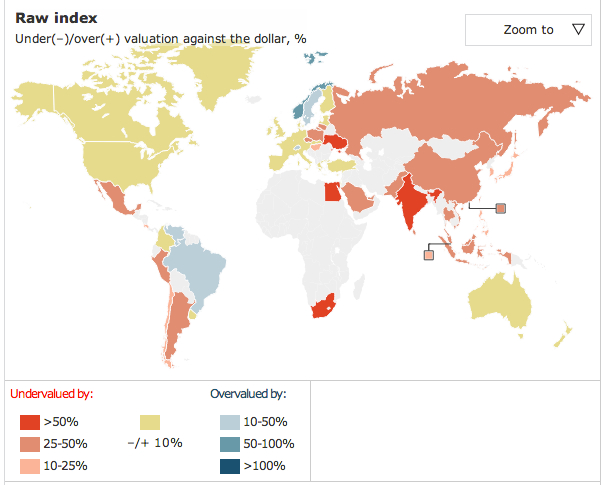
The 2014 Big Mac Index is out and not much has changed. Norway’s Big Macs are most expensive and Chinese Big Macs are cheap.
As The Economist explains, starting in 1986, they wanted to take a lighthearted look at whether currencies were “at their right level.” Economically speaking, they were considering purchasing power parity (PPP). When a market basket of goods and services costs the same in different countries, then people have equal purchasing power (aka: purchasing power parity). Looking below, you can see that Australia and the United States have pretty similar PPPs for hamburgers.
When countries do not have purchasing power parity, we can use a base currency to check for over- and undervaluation. If the base is a $4.79 US Big Mac, then a $7.79 Norwegian Big Mac is overvalued. By contrast, China’s $2.89 Big Mac says their currency is undervalued.
Below, with the US dollar as the base currency, you can see how Big Mac prices vary.

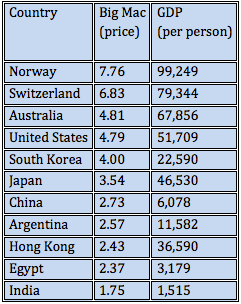
Whereas the map shows a range for under- and overvaluation, I used The Economist’s interactive graphic to identify specific prices and per capita GDPs:

Taking the Big Mac Index a step further, a financial services firm, ConvergEx Group, compared it to the minimum wage in different countries. (Note that the following prices and wages are from August 2013.) Their goal was to see how long people had to work to buy their Big Mac:

Our bottom line: The Big Mac Index is a handy first step in understanding the information that foreign exchange rates can provide.
Hamburger Economics

Elaine Schwartz
Elaine Schwartz has spent her career sharing the interesting side of economics. At the Kent Place School in Summit New Jersey, she was honored with an Endowed Chair in Economics. Just published, her newest book, Degree in a Book: Economics (Arcturus 2023), gives readers a lighthearted look at what definitely is not “the dismal science.” She has also written and updated Econ 101 ½ (Avon Books/Harper Collins 1995) and Economics: Our American Economy (Addison Wesley 1994). In addition, Elaine has articles in the Encyclopedia of New Jersey (Rutgers University Press) and was a featured teacher in the Annenberg/CPB video project “The Economics Classroom.” Beyond the classroom, she has presented Econ 101 ½ talks and led workshops for the Foundation for Teaching Economics, the National Council on Economic Education and for the Concord Coalition. Online for more than a decade. econlife has had one million+ visits.


