
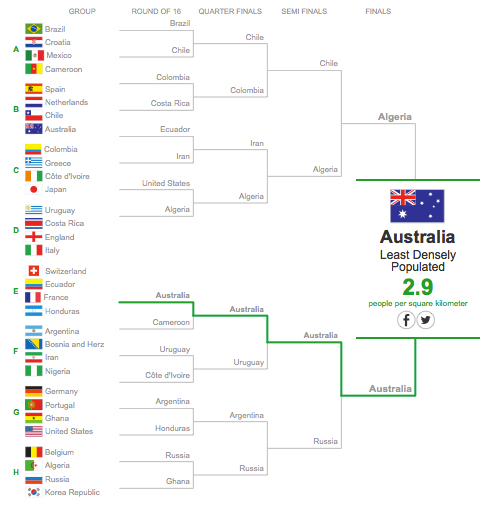
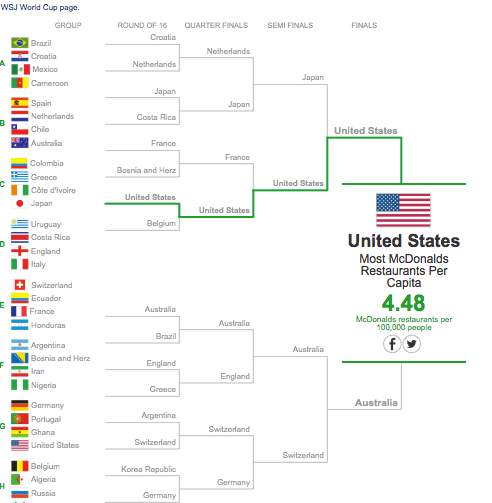
In a long list of categories that they called, “The World Cup of Everything Else,” WSJ created brackets from the 32 World Cup teams and determined the winners. In 6 areas, Australia was #1 or #2:
For life expectancy, Australia comes in 2nd:

Here she is #1:
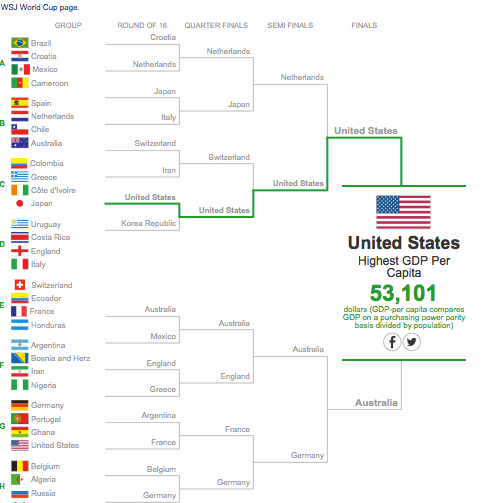
For GDP per capita, among the Word Cup teams, Australia is #2.
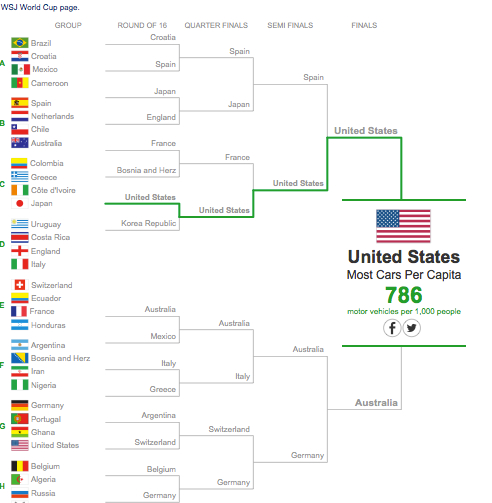
Compared to other World Cup teams, Australia has many cars per person:
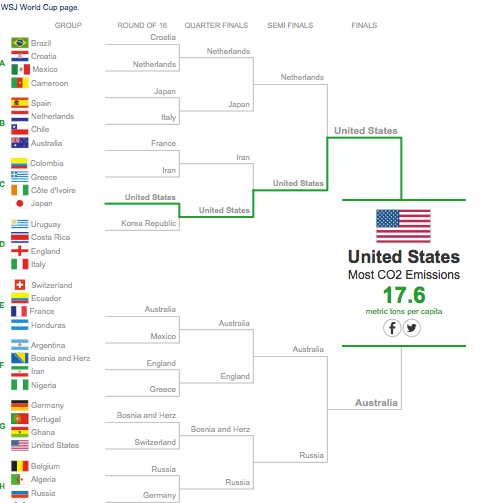
Perhaps predictably, she has relatively high CO2 emissions:
And finally, Australia is almost at the top for the number of McDonalds for each person (but not Starbucks–The US is #1 and South Korea #2)
Our bottom line: The characteristics that Australia shared with her “toughest competition” in this WSJ tournament were typical of developed nations. We only needed to add an educated populace and advanced technology.
The brackets convey a wealth of information. Please let us know in a comment any conclusions you would add.
Six Facts About Australia From The "World Cup of Everything Else"
Elaine Schwartz
Elaine Schwartz has spent her career sharing the interesting side of economics. At the Kent Place School in Summit New Jersey, she was honored with an Endowed Chair in Economics. Just published, her newest book, Degree in a Book: Economics (Arcturus 2023), gives readers a lighthearted look at what definitely is not “the dismal science.” She has also written and updated Econ 101 ½ (Avon Books/Harper Collins 1995) and Economics: Our American Economy (Addison Wesley 1994). In addition, Elaine has articles in the Encyclopedia of New Jersey (Rutgers University Press) and was a featured teacher in the Annenberg/CPB video project “The Economics Classroom.” Beyond the classroom, she has presented Econ 101 ½ talks and led workshops for the Foundation for Teaching Economics, the National Council on Economic Education and for the Concord Coalition. Online for more than a decade. econlife has had one million+ visits.